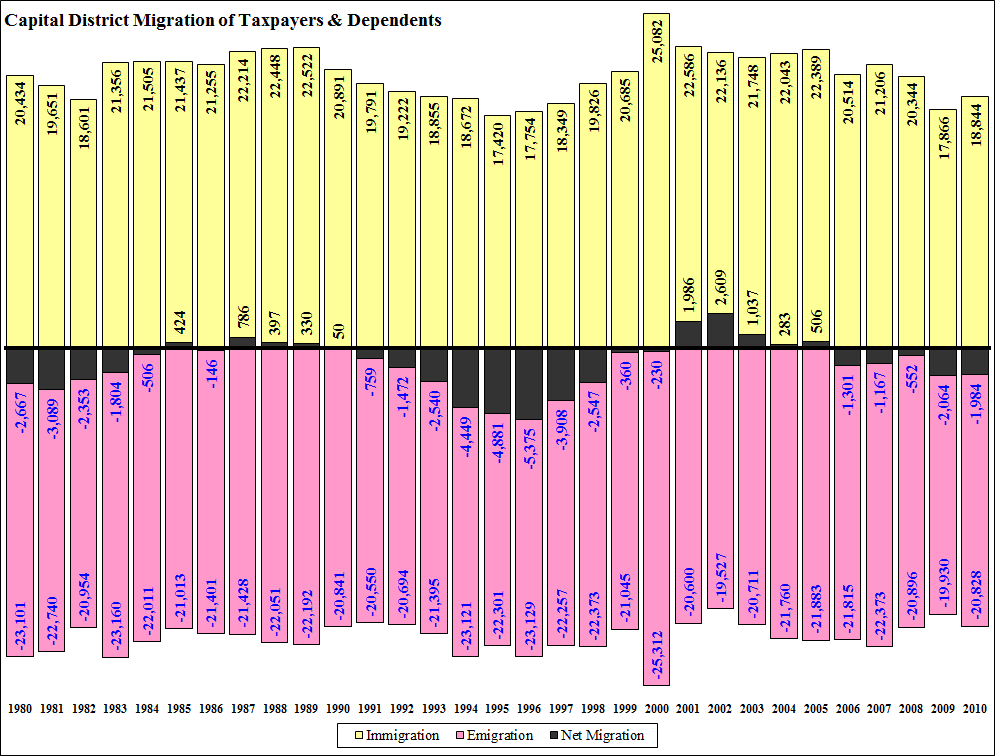
The two primary sources of information used to construct population estimates are natural growth (the net difference between births and deaths) and migration. While birth and death statistics are available from the N.Y.S. Dept. of Health at the municipal level, the primary source for migration data is the Internal Revenue Service. Using information collected from federal tax returns, the IRS prepares annual tables showing both in- and out-migration figures for each county in the nation.
Since individuals are required to identify their primary residence on their federal tax returns, the Internal Revenue Service is able to compare tax return addresses from one year to the next and generate data on the relocation patterns of tax filers migrating to or from a particular county. For enumeration purposes, each individual return is considered a "household," while the total number of exemptions claimed is used as a proxy for the number of persons.
Unlike the New York State forms, federal tax returns do not ask for the filer's county of residence, so there will be quite significant (but consistent over time) errors in assigning taxpayers and their dependents to counties based on their reported zip codes. Since returns are matched by the social security number of the primary taxpayer, any errors in the social security number by either the taxpayer or IRS will lead to errors in identifying county migrants and non-migrants (i.e., recently relocated residents versus those who have resided within a county for at least a year).
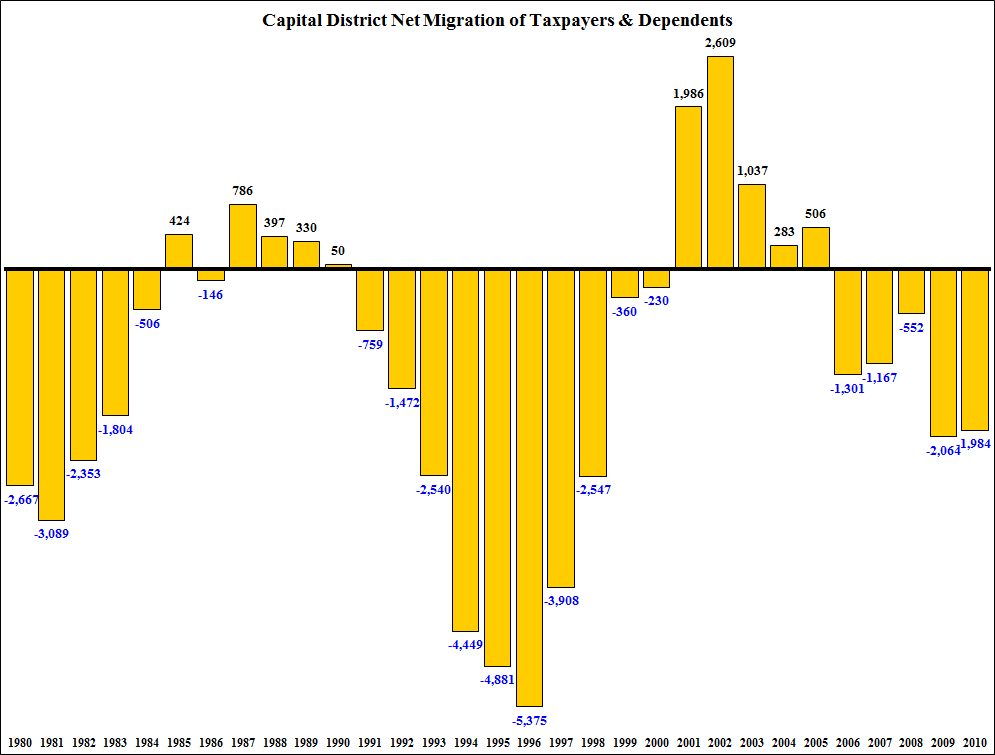
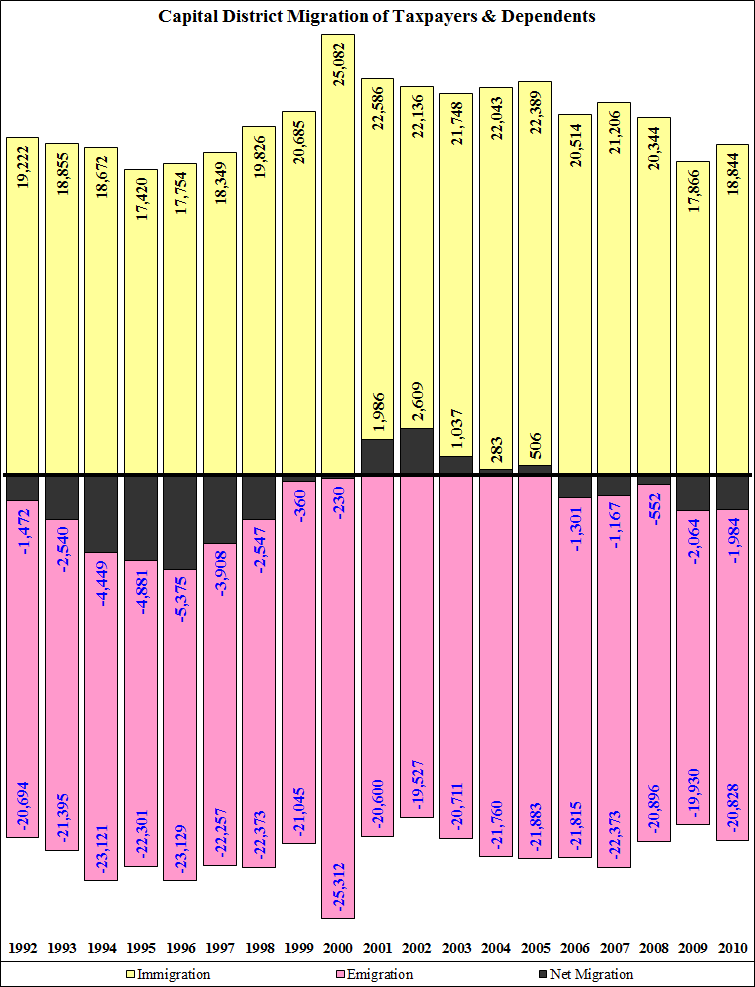
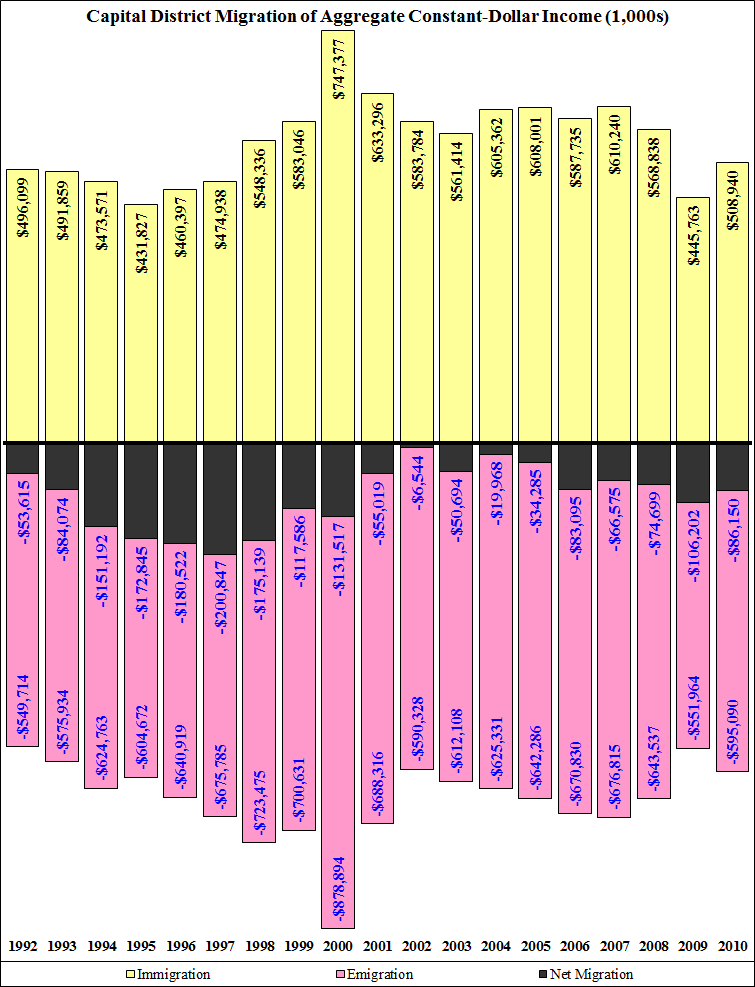
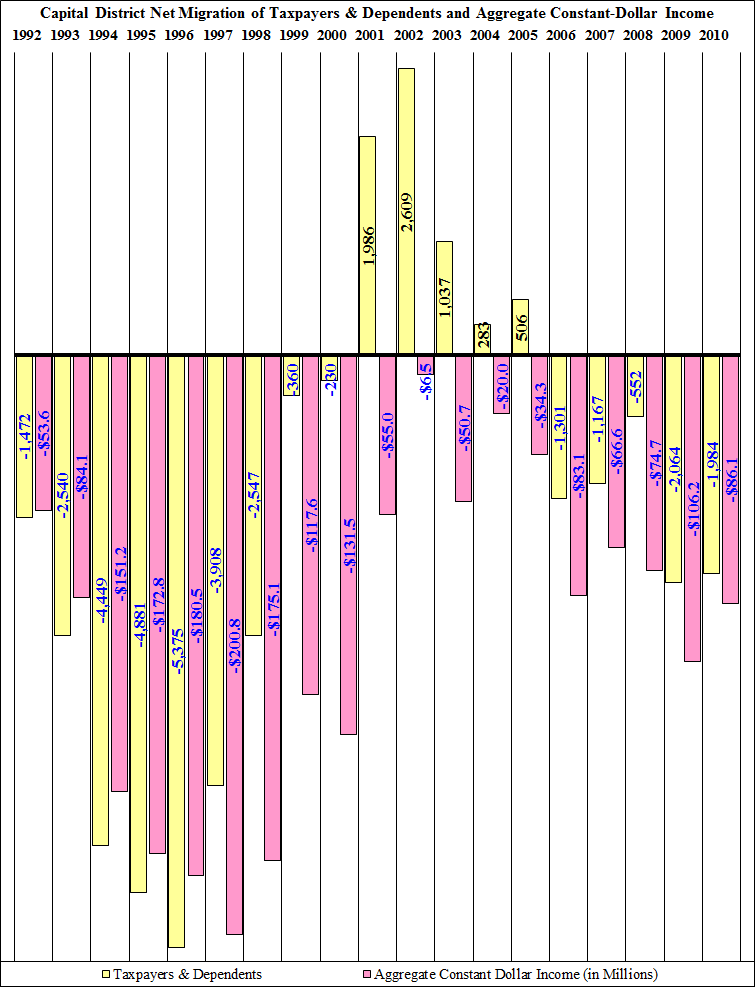
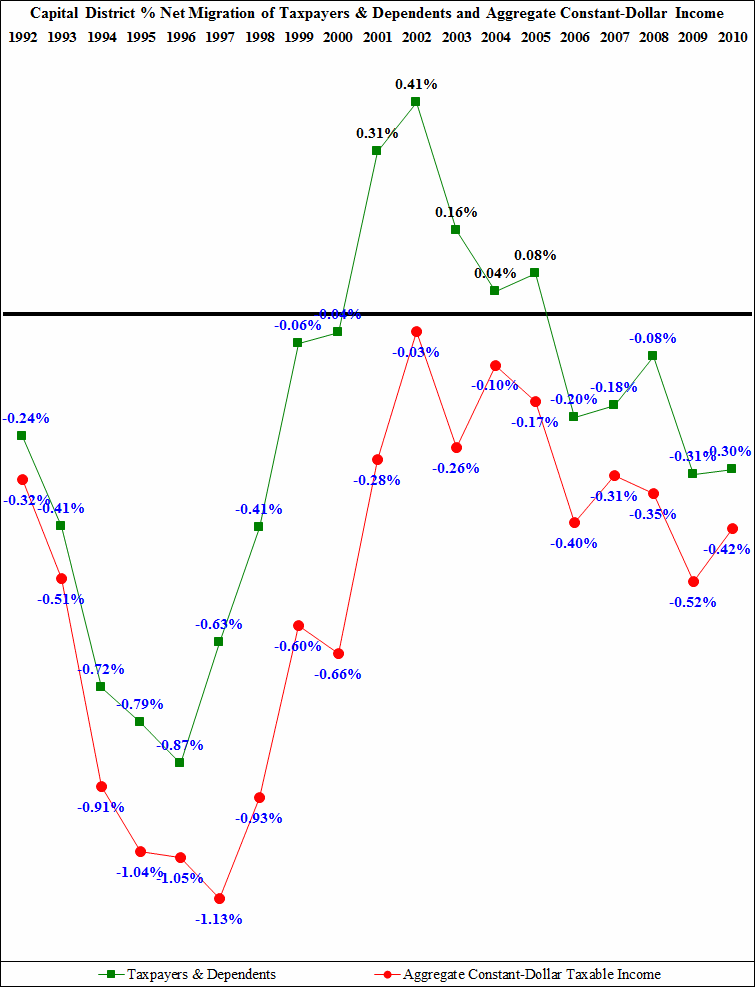
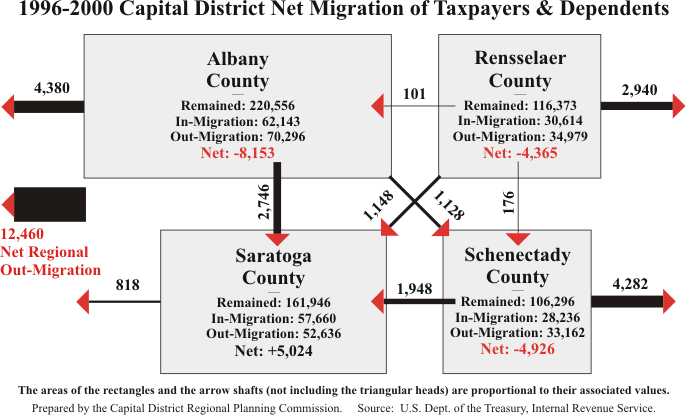
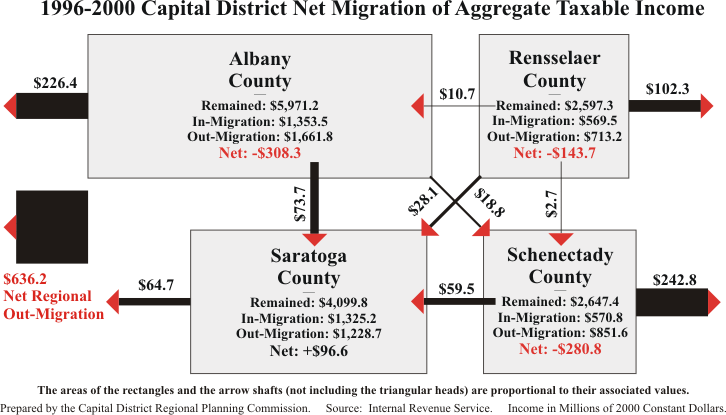
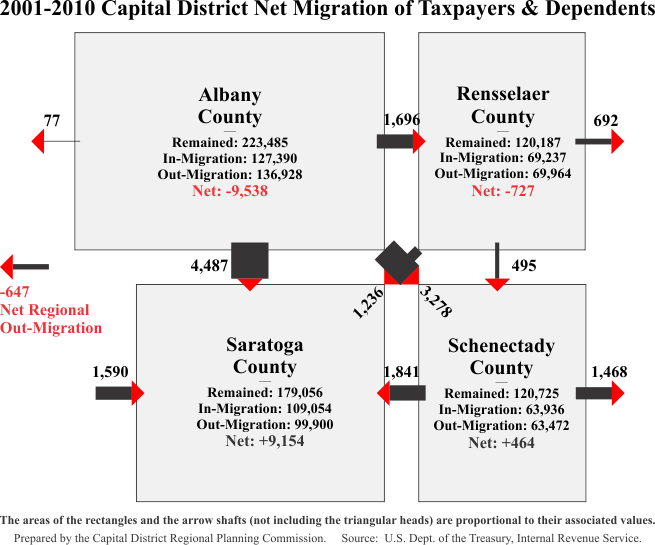
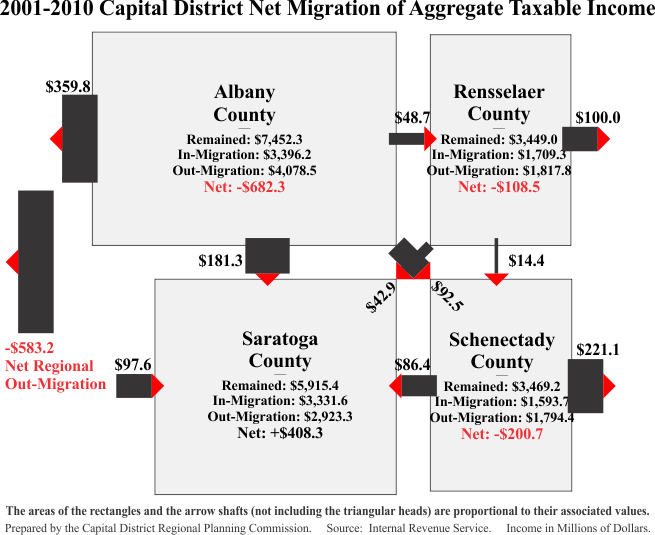
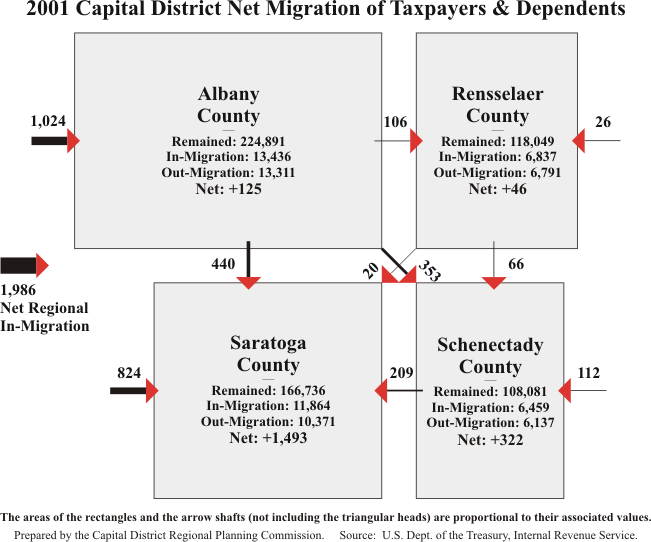
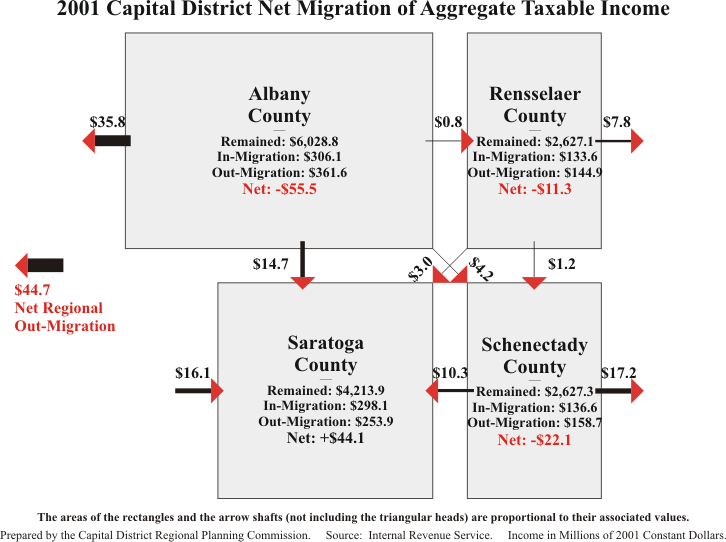
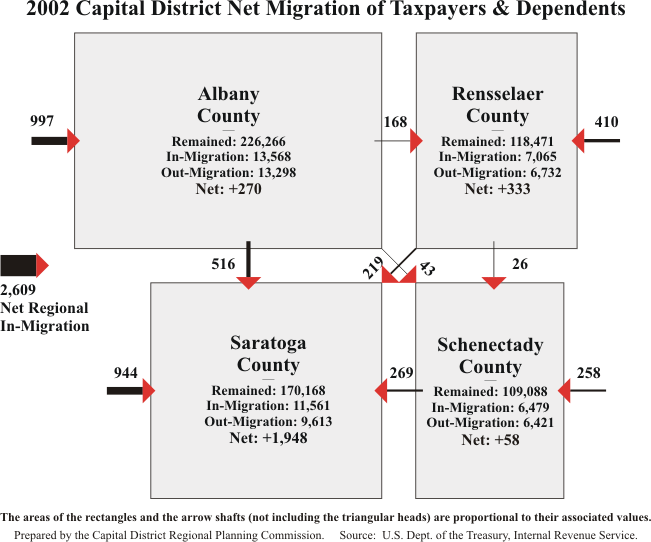
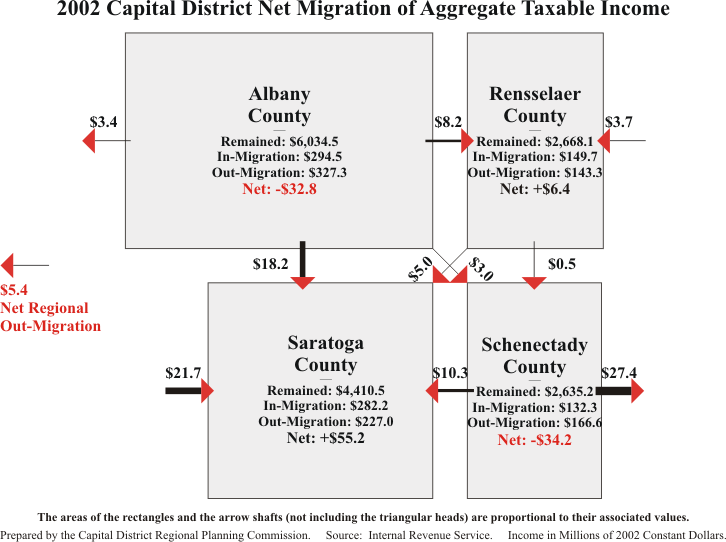
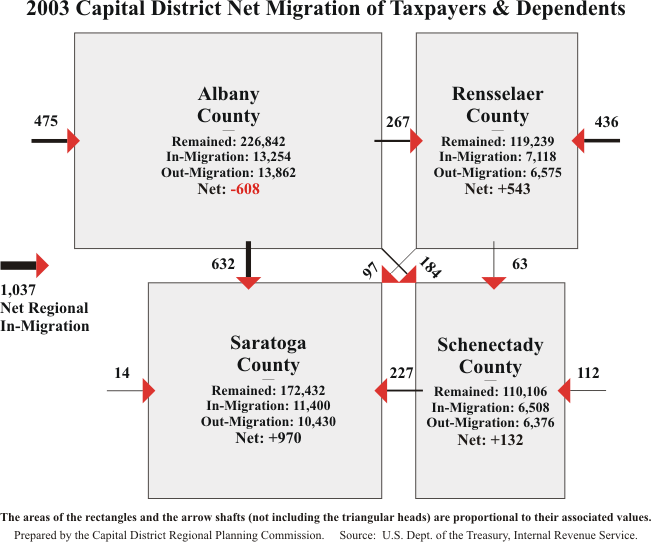
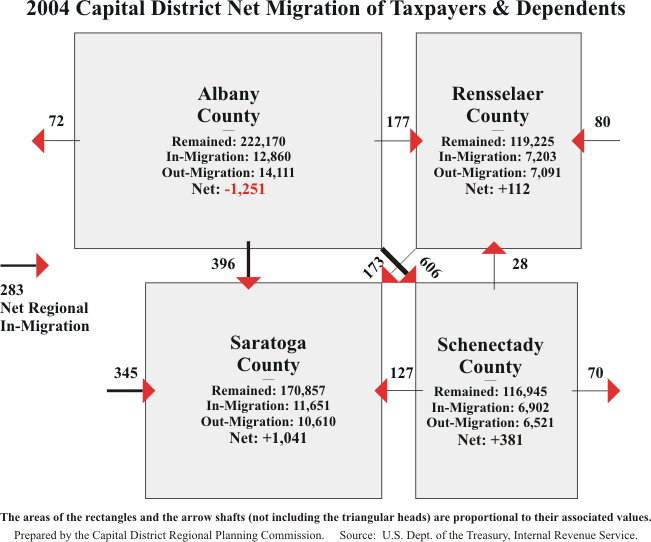
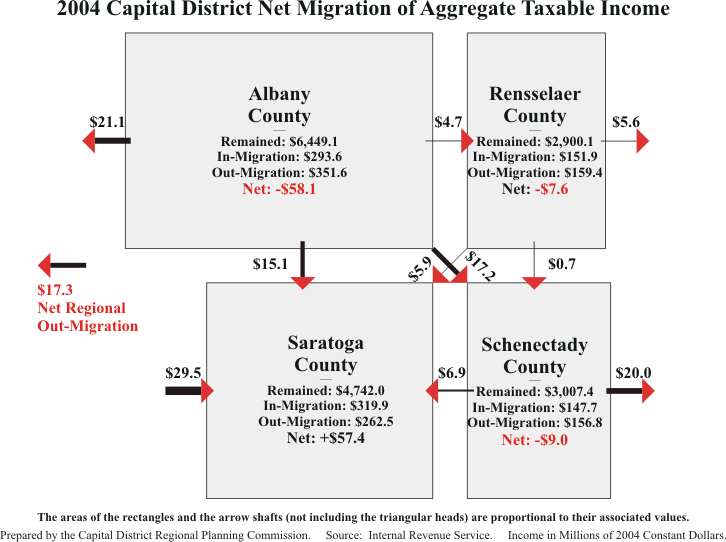
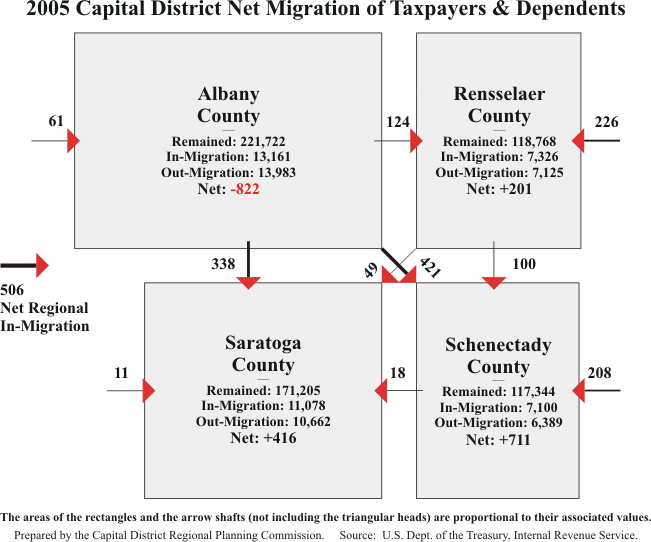
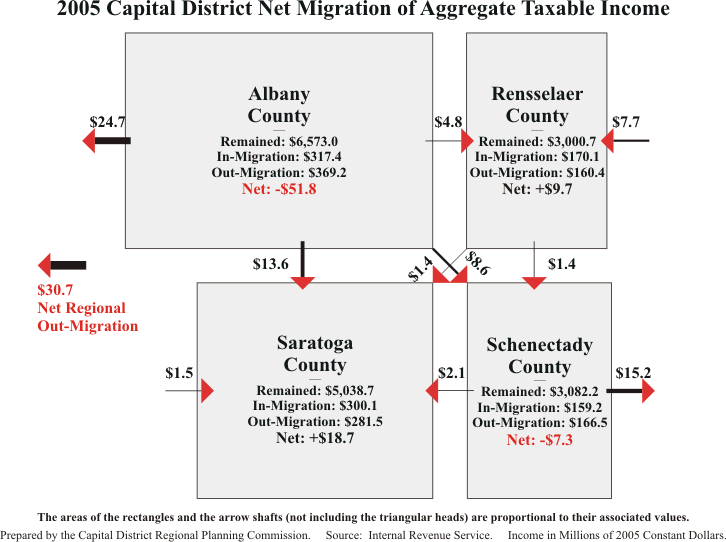
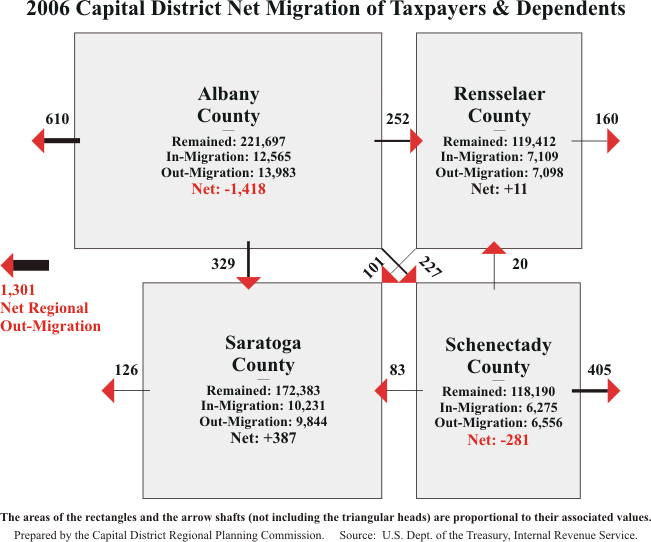
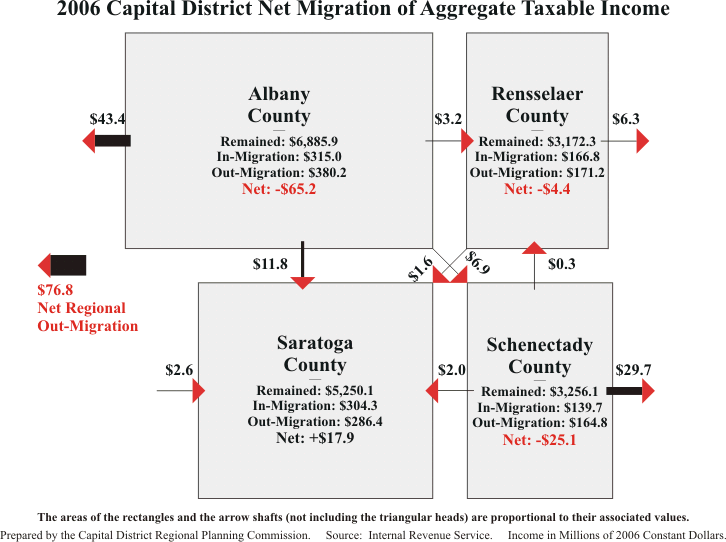
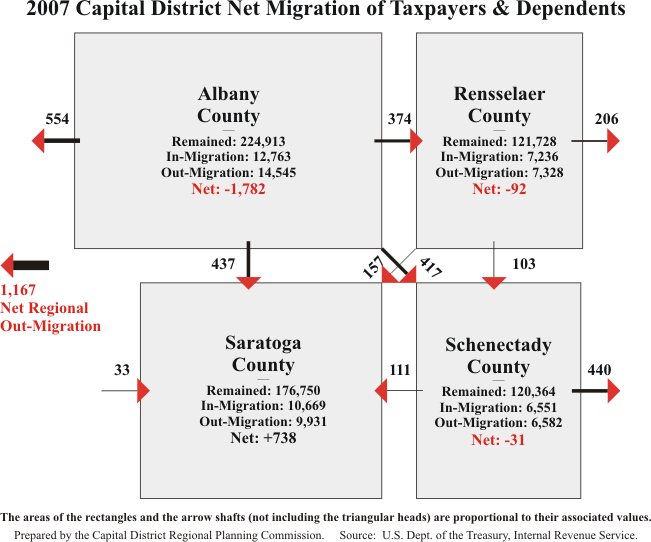
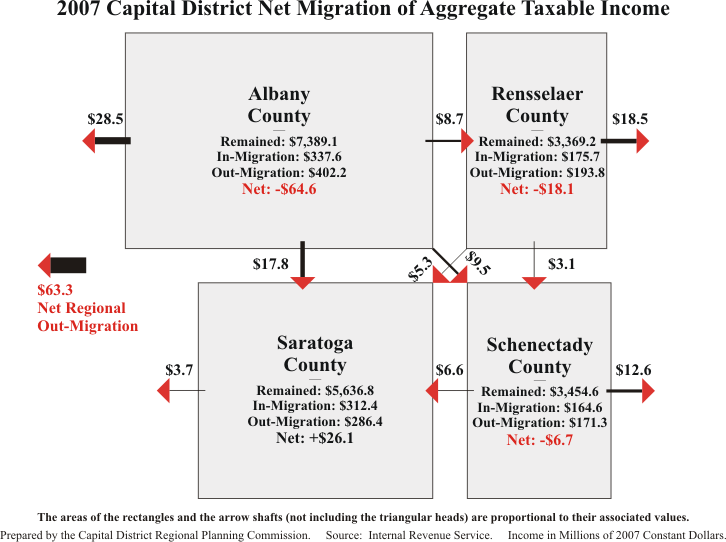
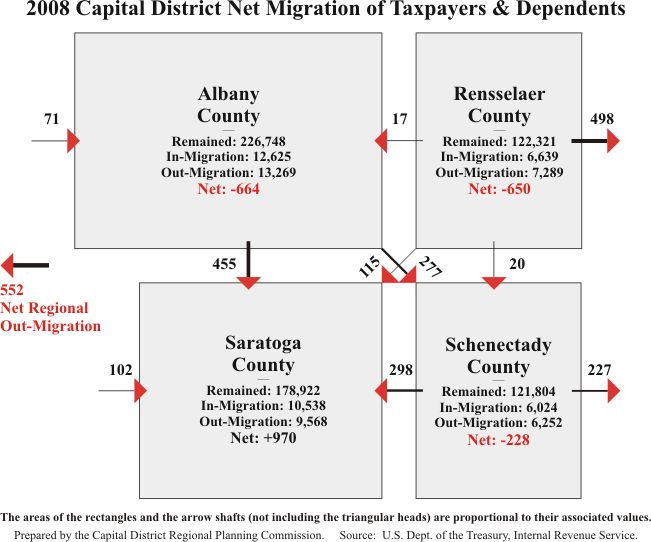
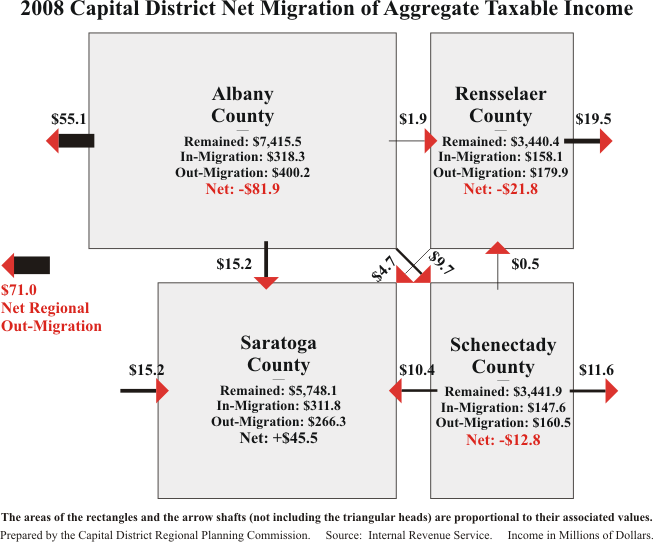
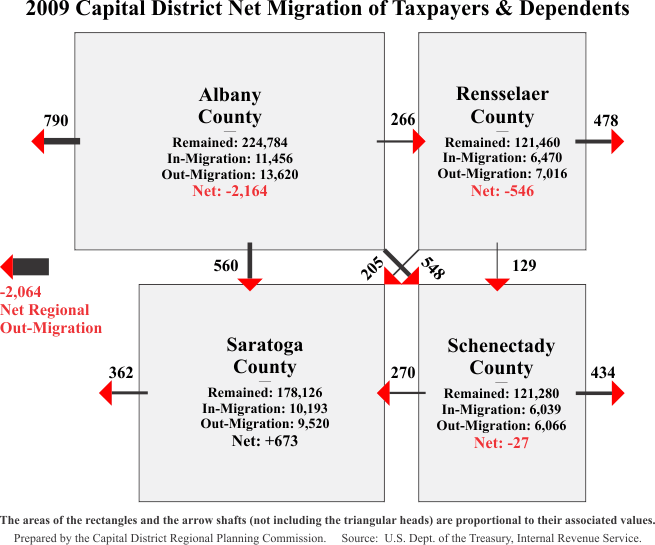
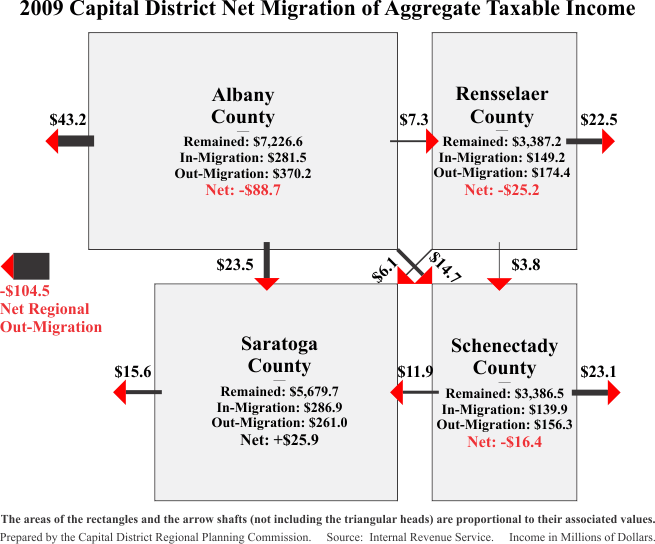
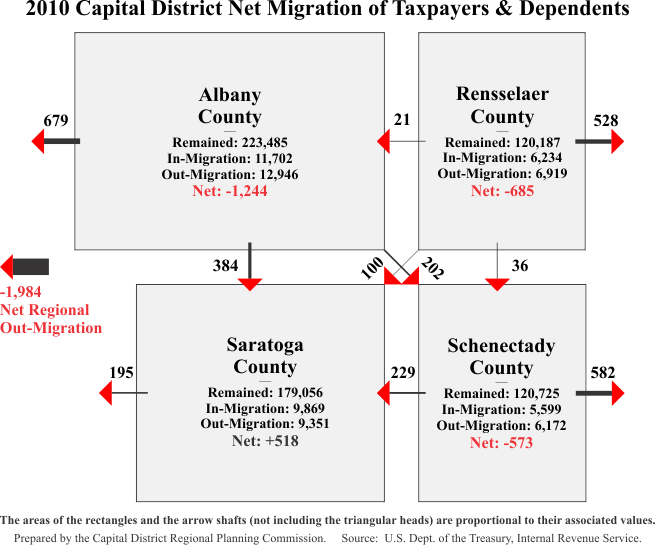
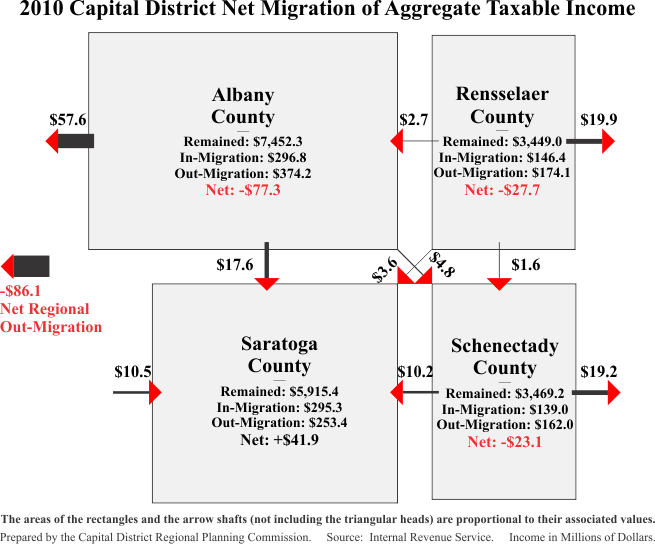
The number of dependents identified on an individual's tax return in consecutive years may vary due to births, deaths, marriages, and dependents whose changed status no longer allows them to be claimed as dependents. Finally, the data do not include the substantial number of residents who either were filing a tax return for the very first time, did not file a tax return, or were not claimed as exemptions on another county resident's tax return. For instance, IRS reported 605,401 total exemptions for the Region in 2000, which represented only 76.2% of the U.S. Census Bureaus 2000 total population for the Capital Region of 794,293. Accordingly, in the charts and diagrams which follow, it should be carefully noted that the IRS migration figures refer only to taxpayers and their dependents, and aggregate taxable (adjusted for inflation). Also note that the aggregate income data have been available only since 1992.
Capital District Migration Graphics |
||
|---|---|---|
| Charts Regional Charts County-Level Charts |
Diagrams 1996-2000 2001-2010 2001 2002 2003 2004 2005 2006 2007 2008 2009 2010 |
|
| Return to List |
|---|

| Return to List |
|---|
| Return to List |
|---|
| Return to List |
|---|
| Return to List |
|---|
| Return to List |
|---|

| Return to List |
|---|
| Return to List |
|---|
| Return to List |
|---|
| Return to List |
|---|
| Return to List |
|---|
| Return to List |
|---|
| Return to List |
|---|
| Return to List |
|---|
Additional economic data and analyses may be found in CDRPC's publications. For more information, see CDRPC Publications.
 Return to CDRPC Home Page