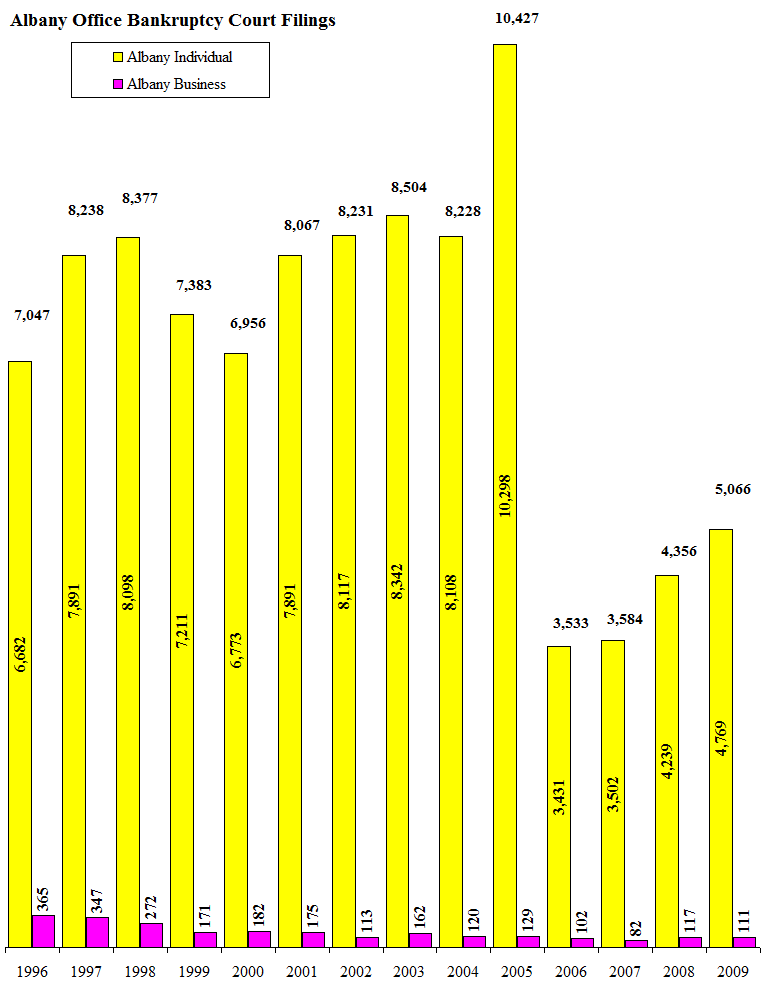
The table and chart below contain time series data from the Albany Office of the United States Bankruptcy Court of the Northern District of New York. The Albany Office serves a 12 county area, including Albany, Clinton, Columbia, Essex, Greene, Rensselaer, Saratoga, Schenectady, Schoharie, Ulster, Warren, and Washington counties.
The data should be regarded as discontinuous between 2004 and 2006 due to the implementation of the Bankruptcy Abuse Prevention and Consumer Protection Act of 2005, which, contrary to its title, made bankruptcy filings far less advantageous for consumers. Every federal District Bankruptcy Court experienced an unusually high volume of filings in 2005 before the new law went into effect.| Albany Bankruptcy Court Statistics | ||||||||||||
|---|---|---|---|---|---|---|---|---|---|---|---|---|
| Liquidation | Corporate Reorganization | Farmers & Fisherman Reorganization | Reorganization | Ancillary & Other Cross Border Cases | Albany Total | Albany Individual | Albany Business | |||||
| Chapter 7 Individual | Chapter 7 Business | Chapter 7 Total | Chapter 11 | Chapter 12 | Chapter 13 Individual | Chapter 13 Business | Chapter 13 Total | Chapter 15 | ||||
| 1996 | 5,290 | 217 | 5,507 | 53 | 19 | 1,373 | 95 | 1,468 | 0 | 7,047 | 6,682 | 365 |
| 1997 | 6,237 | 195 | 6,432 | 58 | 14 | 1,640 | 94 | 1,734 | 0 | 8,238 | 7,891 | 347 |
| 1998 | 6,666 | 117 | 6,783 | 12 | 15 | 1,417 | 143 | 1,560 | 0 | 8,377 | 8,098 | 272 |
| 1999 | 5,723 | 93 | 5,816 | 25 | 10 | 1,478 | 53 | 1,531 | 0 | 7,383 | 7,211 | 171 |
| 2000 | 5,331 | 108 | 5,439 | 32 | 8 | 1,434 | 42 | 1,476 | 0 | 6,956 | 6,773 | 182 |
| 2001 | 6,203 | 118 | 6,321 | 25 | 5 | 1,683 | 32 | 1,715 | 0 | 8,067 | 7,891 | 175 |
| 2002 | 6,061 | 64 | 6,125 | 20 | 5 | 2,051 | 29 | 2,080 | 0 | 8,231 | 8,117 | 113 |
| 2003 | 6,149 | 93 | 6,242 | 38 | 10 | 2,183 | 31 | 2,214 | 0 | 8,504 | 8,342 | 162 |
| 2004 | 5,673 | 61 | 5,734 | 23 | 0 | 2,435 | 36 | 2,471 | 0 | 8,228 | 8,108 | 120 |
| 2005 | 7,762 | 77 | 7,839 | 29 | 2 | 2,534 | 23 | 2,557 | 0 | 10,427 | 10,298 | 129 |
| 2006 | 2,190 | 53 | 2,243 | 19 | 1 | 1,240 | 30 | 1,270 | 0 | 3,533 | 3,431 | 102 |
| 2007 | 2,209 | 40 | 2,249 | 17 | 1 | 1,292 | 25 | 1,317 | 0 | 3,584 | 3,502 | 82 |
| 2008 | 2,805 | 65 | 2,870 | 30 | 6 | 1,428 | 22 | 1,450 | 3 | 4,356 | 4,239 | 117 |
| 2009 | 3,411 | 58 | 3,469 | 31 | 5 | 1,353 | 22 | 1,375 | 0 | 5,066 | 4,769 | 111 |

The Capital District Regional Planning Commission has a number of publications which contain demographic and economic data for the Region. For more information, see CDRPC Publications.
 Return to CDRPC Home Page