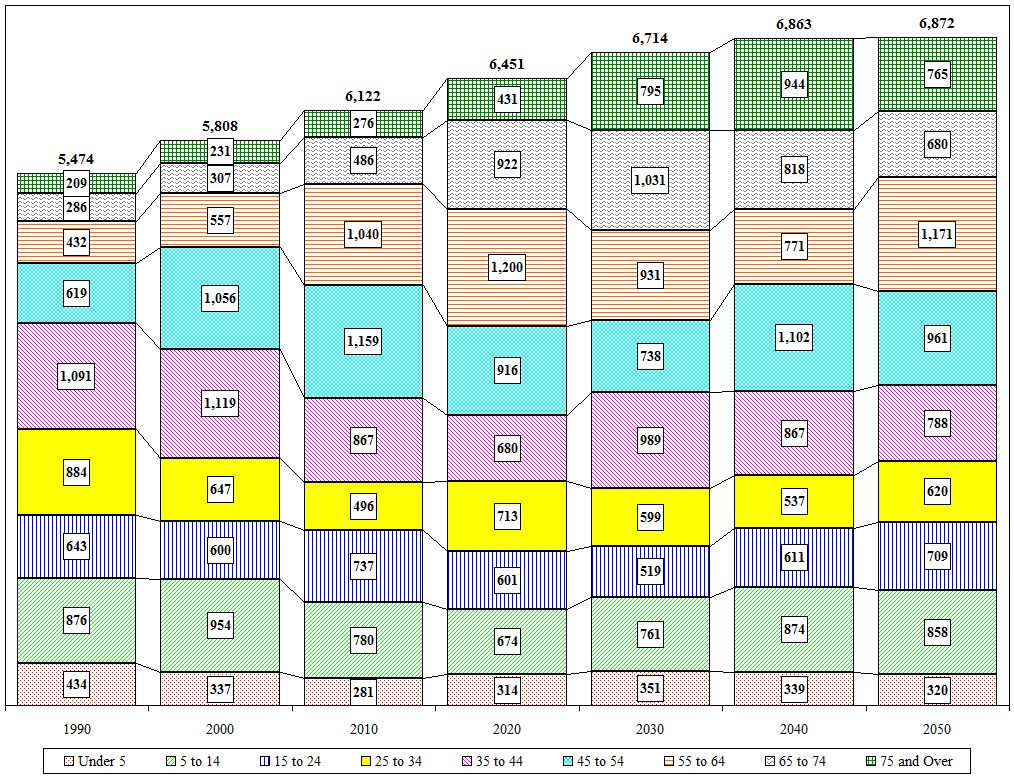
Town of Duanesburg Age Cohort Projections
| Value |
Historic |
Projected |
| Village Values Included |
1990 |
2000 |
2010 |
2020 |
2030 |
2040 |
2050 |
| Total |
5,474 |
5,808 |
6,122 |
6,451 |
6,714 |
6,863 |
6,872 |
| Under 5 |
434 |
337 |
281 |
314 |
351 |
339 |
320 |
| 5 to 14 |
876 |
954 |
780 |
674 |
761 |
874 |
858 |
| 15 to 24 |
643 |
600 |
737 |
601 |
519 |
611 |
709 |
| 25 to 34 |
884 |
647 |
496 |
713 |
599 |
537 |
620 |
| 35 to 44 |
1,091 |
1,119 |
867 |
680 |
989 |
867 |
788 |
| 45 to 54 |
619 |
1,056 |
1,159 |
916 |
738 |
1,102 |
961 |
| 55 to 64 |
432 |
557 |
1,040 |
1,200 |
931 |
771 |
1,171 |
| 65 to 74 |
286 |
307 |
486 |
922 |
1,031 |
818 |
680 |
| 75 and Over |
209 |
231 |
276 |
431 |
795 |
944 |
765 |
| Distribution |
1990 |
2000 |
2010 |
2020 |
2030 |
2040 |
2050 |
| Under 5 |
7.9% |
5.8% |
4.6% |
4.9% |
5.2% |
4.9% |
4.7% |
| 5 to 14 |
16.0% |
16.4% |
12.7% |
10.4% |
11.3% |
12.7% |
12.5% |
| 15 to 24 |
11.7% |
10.3% |
12.0% |
9.3% |
7.7% |
8.9% |
10.3% |
| 25 to 34 |
16.1% |
11.1% |
8.1% |
11.1% |
8.9% |
7.8% |
9.0% |
| 35 to 44 |
19.9% |
19.3% |
14.2% |
10.5% |
14.7% |
12.6% |
11.5% |
| 45 to 54 |
11.3% |
18.2% |
18.9% |
14.2% |
11.0% |
16.1% |
14.0% |
| 55 to 64 |
7.9% |
9.6% |
17.0% |
18.6% |
13.9% |
11.2% |
17.0% |
| 65 to 74 |
5.2% |
5.3% |
7.9% |
14.3% |
15.4% |
11.9% |
9.9% |
| 75 and Over |
3.8% |
4.0% |
4.5% |
6.7% |
11.8% |
13.8% |
11.1% |

Close

