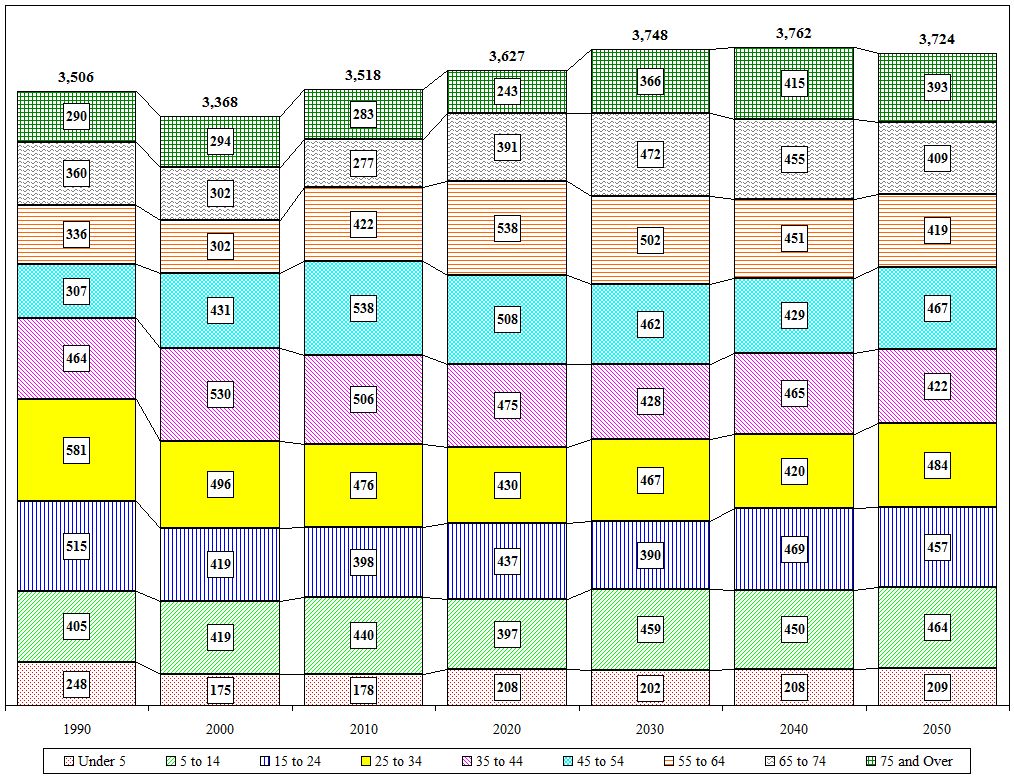
Village of South Glens Falls Age Cohort Projections
| Value |
Historic |
Projected |
| 1990 |
2000 |
2010 |
2020 |
2030 |
2040 |
2050 |
| Total |
3,506 |
3,368 |
3,518 |
3,627 |
3,748 |
3,762 |
3,724 |
| Under 5 |
248 |
175 |
178 |
208 |
202 |
208 |
209 |
| 5 to 14 |
405 |
419 |
440 |
397 |
459 |
450 |
464 |
| 15 to 24 |
515 |
419 |
398 |
437 |
390 |
469 |
457 |
| 25 to 34 |
581 |
496 |
476 |
430 |
467 |
420 |
484 |
| 35 to 44 |
464 |
530 |
506 |
475 |
428 |
465 |
422 |
| 45 to 54 |
307 |
431 |
538 |
508 |
462 |
429 |
467 |
| 55 to 64 |
336 |
302 |
422 |
538 |
502 |
451 |
419 |
| 65 to 74 |
360 |
302 |
277 |
391 |
472 |
455 |
409 |
| 75 and Over |
290 |
294 |
283 |
243 |
366 |
415 |
393 |
| Distribution |
1990 |
2000 |
2010 |
2020 |
2030 |
2040 |
2050 |
| Under 5 |
7.1% |
5.2% |
5.1% |
5.7% |
5.4% |
5.5% |
5.6% |
| 5 to 14 |
11.6% |
12.4% |
12.5% |
10.9% |
12.2% |
12.0% |
12.5% |
| 15 to 24 |
14.7% |
12.4% |
11.3% |
12.0% |
10.4% |
12.5% |
12.3% |
| 25 to 34 |
16.6% |
14.7% |
13.5% |
11.9% |
12.5% |
11.2% |
13.0% |
| 35 to 44 |
13.2% |
15.7% |
14.4% |
13.1% |
11.4% |
12.4% |
11.3% |
| 45 to 54 |
8.8% |
12.8% |
15.3% |
14.0% |
12.3% |
11.4% |
12.5% |
| 55 to 64 |
9.6% |
9.0% |
12.0% |
14.8% |
13.4% |
12.0% |
11.3% |
| 65 to 74 |
10.3% |
9.0% |
7.9% |
10.8% |
12.6% |
12.1% |
11.0% |
| 75 and Over |
8.3% |
8.7% |
8.0% |
6.7% |
9.8% |
11.0% |
10.6% |

Close

