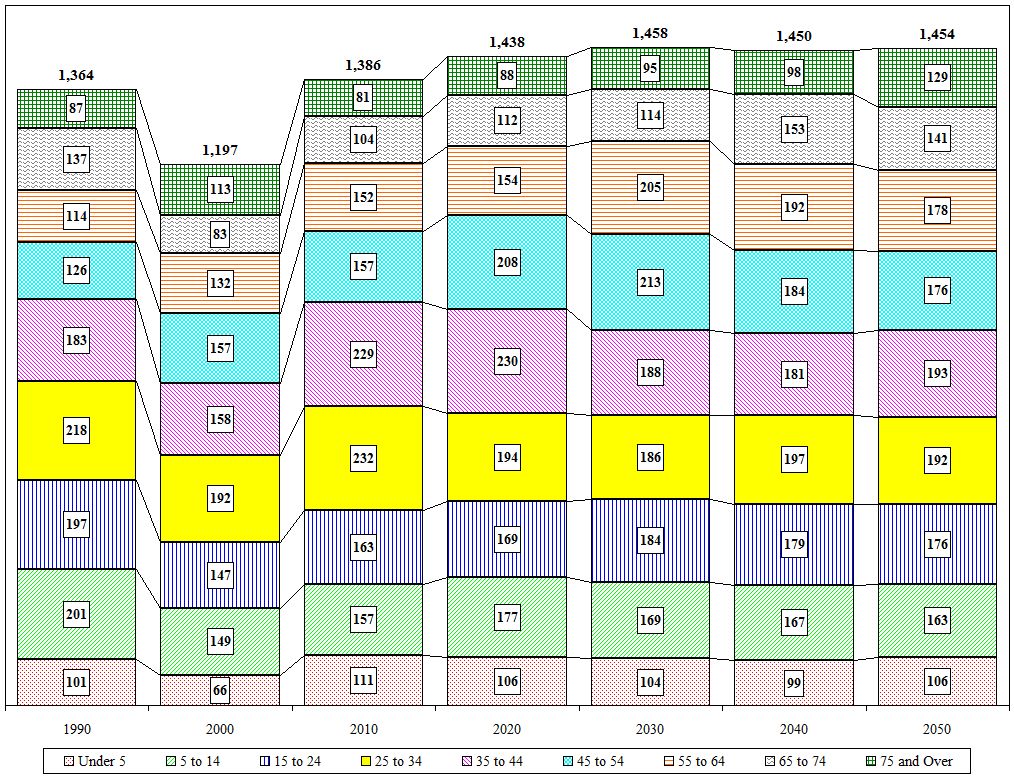
Village of Schuylerville Age Cohort Projections
| Value |
Historic |
Projected |
| 1990 |
2000 |
2010 |
2020 |
2030 |
2040 |
2050 |
| Total |
1,364 |
1,197 |
1,386 |
1,438 |
1,458 |
1,450 |
1,454 |
| Under 5 |
101 |
66 |
111 |
106 |
104 |
99 |
106 |
| 5 to 14 |
201 |
149 |
157 |
177 |
169 |
167 |
163 |
| 15 to 24 |
197 |
147 |
163 |
169 |
184 |
179 |
176 |
| 25 to 34 |
218 |
192 |
232 |
194 |
186 |
197 |
192 |
| 35 to 44 |
183 |
158 |
229 |
230 |
188 |
181 |
193 |
| 45 to 54 |
126 |
157 |
157 |
208 |
213 |
184 |
176 |
| 55 to 64 |
114 |
132 |
152 |
154 |
205 |
192 |
178 |
| 65 to 74 |
137 |
83 |
104 |
112 |
114 |
153 |
141 |
| 75 and Over |
87 |
113 |
81 |
88 |
95 |
98 |
129 |
| Distribution |
1990 |
2000 |
2010 |
2020 |
2030 |
2040 |
2050 |
| Under 5 |
7.4% |
5.5% |
8.0% |
7.4% |
7.1% |
6.8% |
7.3% |
| 5 to 14 |
14.7% |
12.4% |
11.3% |
12.3% |
11.6% |
11.5% |
11.2% |
| 15 to 24 |
14.4% |
12.3% |
11.8% |
11.8% |
12.6% |
12.3% |
12.1% |
| 25 to 34 |
16.0% |
16.0% |
16.7% |
13.5% |
12.8% |
13.6% |
13.2% |
| 35 to 44 |
13.4% |
13.2% |
16.5% |
16.0% |
12.9% |
12.5% |
13.3% |
| 45 to 54 |
9.2% |
13.1% |
11.3% |
14.5% |
14.6% |
12.7% |
12.1% |
| 55 to 64 |
8.4% |
11.0% |
11.0% |
10.7% |
14.1% |
13.2% |
12.2% |
| 65 to 74 |
10.0% |
6.9% |
7.5% |
7.8% |
7.8% |
10.6% |
9.7% |
| 75 and Over |
6.4% |
9.4% |
5.8% |
6.1% |
6.5% |
6.8% |
8.9% |

Close

