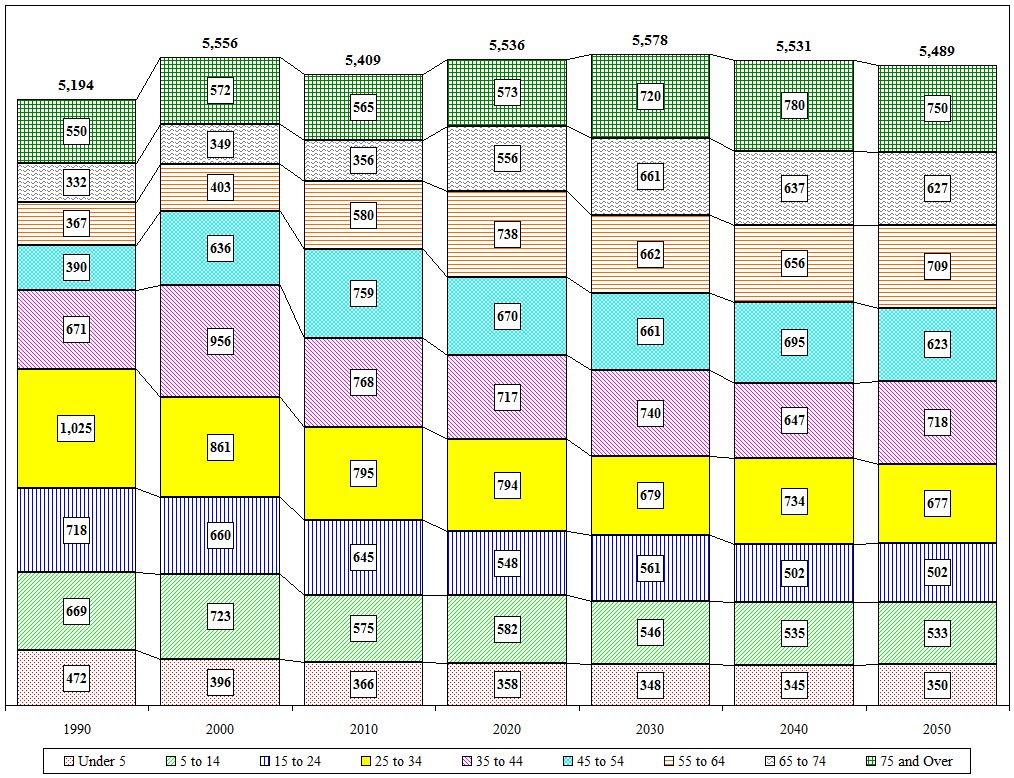
Village of Ballston Spa (all) Age Cohort Projections
| Value |
Historic |
Projected |
| 1990 |
2000 |
2010 |
2020 |
2030 |
2040 |
2050 |
| Total |
5,194 |
5,556 |
5,409 |
5,536 |
5,578 |
5,531 |
5,489 |
| Under 5 |
472 |
396 |
366 |
358 |
348 |
345 |
350 |
| 5 to 14 |
669 |
723 |
575 |
582 |
546 |
535 |
533 |
| 15 to 24 |
718 |
660 |
645 |
548 |
561 |
502 |
502 |
| 25 to 34 |
1,025 |
861 |
795 |
794 |
679 |
734 |
677 |
| 35 to 44 |
671 |
956 |
768 |
717 |
740 |
647 |
718 |
| 45 to 54 |
390 |
636 |
759 |
670 |
661 |
695 |
623 |
| 55 to 64 |
367 |
403 |
580 |
738 |
662 |
656 |
709 |
| 65 to 74 |
332 |
349 |
356 |
556 |
661 |
637 |
627 |
| 75 and Over |
550 |
572 |
565 |
573 |
720 |
780 |
750 |
| Distribution |
1990 |
2000 |
2010 |
2020 |
2030 |
2040 |
2050 |
| Under 5 |
9.1% |
7.1% |
6.8% |
6.5% |
6.2% |
6.2% |
6.4% |
| 5 to 14 |
12.9% |
13.0% |
10.6% |
10.5% |
9.8% |
9.7% |
9.7% |
| 15 to 24 |
13.8% |
11.9% |
11.9% |
9.9% |
10.1% |
9.1% |
9.1% |
| 25 to 34 |
19.7% |
15.5% |
14.7% |
14.3% |
12.2% |
13.3% |
12.3% |
| 35 to 44 |
12.9% |
17.2% |
14.2% |
13.0% |
13.3% |
11.7% |
13.1% |
| 45 to 54 |
7.5% |
11.4% |
14.0% |
12.1% |
11.9% |
12.6% |
11.3% |
| 55 to 64 |
7.1% |
7.3% |
10.7% |
13.3% |
11.9% |
11.9% |
12.9% |
| 65 to 74 |
6.4% |
6.3% |
6.6% |
10.0% |
11.9% |
11.5% |
11.4% |
| 75 and Over |
10.6% |
10.3% |
10.4% |
10.4% |
12.9% |
14.1% |
13.7% |

Close

