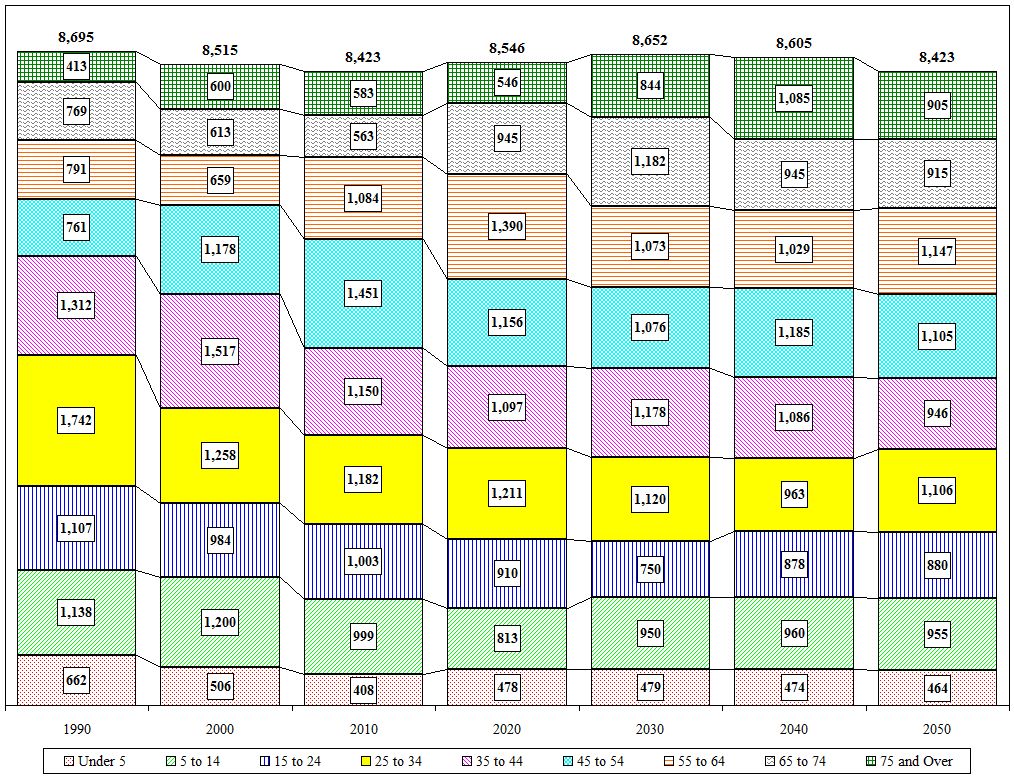
Town of Waterford Age Cohort Projections
| Value |
Historic |
Projected |
| Village Values Included |
1990 |
2000 |
2010 |
2020 |
2030 |
2040 |
2050 |
| Total |
8,695 |
8,515 |
8,423 |
8,546 |
8,652 |
8,605 |
8,423 |
| Under 5 |
662 |
506 |
408 |
478 |
479 |
474 |
464 |
| 5 to 14 |
1,138 |
1,200 |
999 |
813 |
950 |
960 |
955 |
| 15 to 24 |
1,107 |
984 |
1,003 |
910 |
750 |
878 |
880 |
| 25 to 34 |
1,742 |
1,258 |
1,182 |
1,211 |
1,120 |
963 |
1,106 |
| 35 to 44 |
1,312 |
1,517 |
1,150 |
1,097 |
1,178 |
1,086 |
946 |
| 45 to 54 |
761 |
1,178 |
1,451 |
1,156 |
1,076 |
1,185 |
1,105 |
| 55 to 64 |
791 |
659 |
1,084 |
1,390 |
1,073 |
1,029 |
1,147 |
| 65 to 74 |
769 |
613 |
563 |
945 |
1,182 |
945 |
915 |
| 75 and Over |
413 |
600 |
583 |
546 |
844 |
1,085 |
905 |
| Distribution |
1990 |
2000 |
2010 |
2020 |
2030 |
2040 |
2050 |
| Under 5 |
7.6% |
5.9% |
4.8% |
5.6% |
5.5% |
5.5% |
5.5% |
| 5 to 14 |
13.1% |
14.1% |
11.9% |
9.5% |
11.0% |
11.2% |
11.3% |
| 15 to 24 |
12.7% |
11.6% |
11.9% |
10.6% |
8.7% |
10.2% |
10.4% |
| 25 to 34 |
20.0% |
14.8% |
14.0% |
14.2% |
12.9% |
11.2% |
13.1% |
| 35 to 44 |
15.1% |
17.8% |
13.7% |
12.8% |
13.6% |
12.6% |
11.2% |
| 45 to 54 |
8.8% |
13.8% |
17.2% |
13.5% |
12.4% |
13.8% |
13.1% |
| 55 to 64 |
9.1% |
7.7% |
12.9% |
16.3% |
12.4% |
12.0% |
13.6% |
| 65 to 74 |
8.8% |
7.2% |
6.7% |
11.1% |
13.7% |
11.0% |
10.9% |
| 75 and Over |
4.7% |
7.0% |
6.9% |
6.4% |
9.8% |
12.6% |
10.7% |

Close

