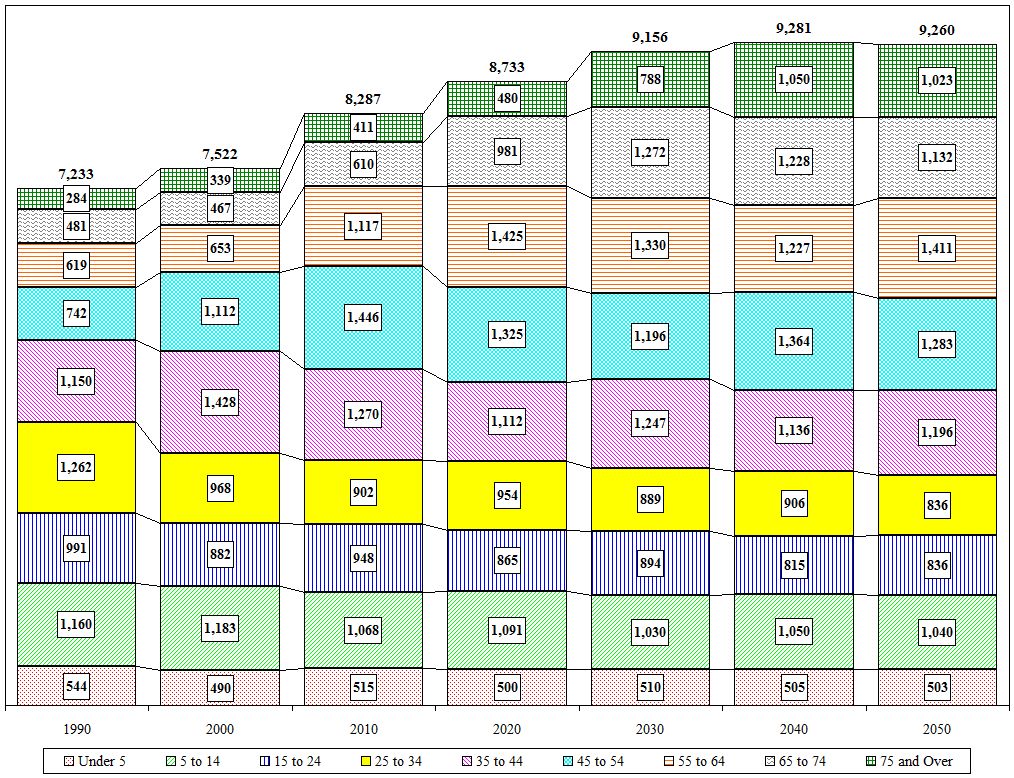
Town of Stillwater Age Cohort Projections
| Value |
Historic |
Projected |
| Village Values Included |
1990 |
2000 |
2010 |
2020 |
2030 |
2040 |
2050 |
| Total |
7,233 |
7,522 |
8,287 |
8,733 |
9,156 |
9,281 |
9,260 |
| Under 5 |
544 |
490 |
515 |
500 |
510 |
505 |
503 |
| 5 to 14 |
1,160 |
1,183 |
1,068 |
1,091 |
1,030 |
1,050 |
1,040 |
| 15 to 24 |
991 |
882 |
948 |
865 |
894 |
815 |
836 |
| 25 to 34 |
1,262 |
968 |
902 |
954 |
889 |
906 |
836 |
| 35 to 44 |
1,150 |
1,428 |
1,270 |
1,112 |
1,247 |
1,136 |
1,196 |
| 45 to 54 |
742 |
1,112 |
1,446 |
1,325 |
1,196 |
1,364 |
1,283 |
| 55 to 64 |
619 |
653 |
1,117 |
1,425 |
1,330 |
1,227 |
1,411 |
| 65 to 74 |
481 |
467 |
610 |
981 |
1,272 |
1,228 |
1,132 |
| 75 and Over |
284 |
339 |
411 |
480 |
788 |
1,050 |
1,023 |
| Distribution |
1990 |
2000 |
2010 |
2020 |
2030 |
2040 |
2050 |
| Under 5 |
7.5% |
6.5% |
6.2% |
5.7% |
5.6% |
5.4% |
5.4% |
| 5 to 14 |
16.0% |
15.7% |
12.9% |
12.5% |
11.2% |
11.3% |
11.2% |
| 15 to 24 |
13.7% |
11.7% |
11.4% |
9.9% |
9.8% |
8.8% |
9.0% |
| 25 to 34 |
17.4% |
12.9% |
10.9% |
10.9% |
9.7% |
9.8% |
9.0% |
| 35 to 44 |
15.9% |
19.0% |
15.3% |
12.7% |
13.6% |
12.2% |
12.9% |
| 45 to 54 |
10.3% |
14.8% |
17.4% |
15.2% |
13.1% |
14.7% |
13.9% |
| 55 to 64 |
8.6% |
8.7% |
13.5% |
16.3% |
14.5% |
13.2% |
15.2% |
| 65 to 74 |
6.7% |
6.2% |
7.4% |
11.2% |
13.9% |
13.2% |
12.2% |
| 75 and Over |
3.9% |
4.5% |
5.0% |
5.5% |
8.6% |
11.3% |
11.0% |

Close

