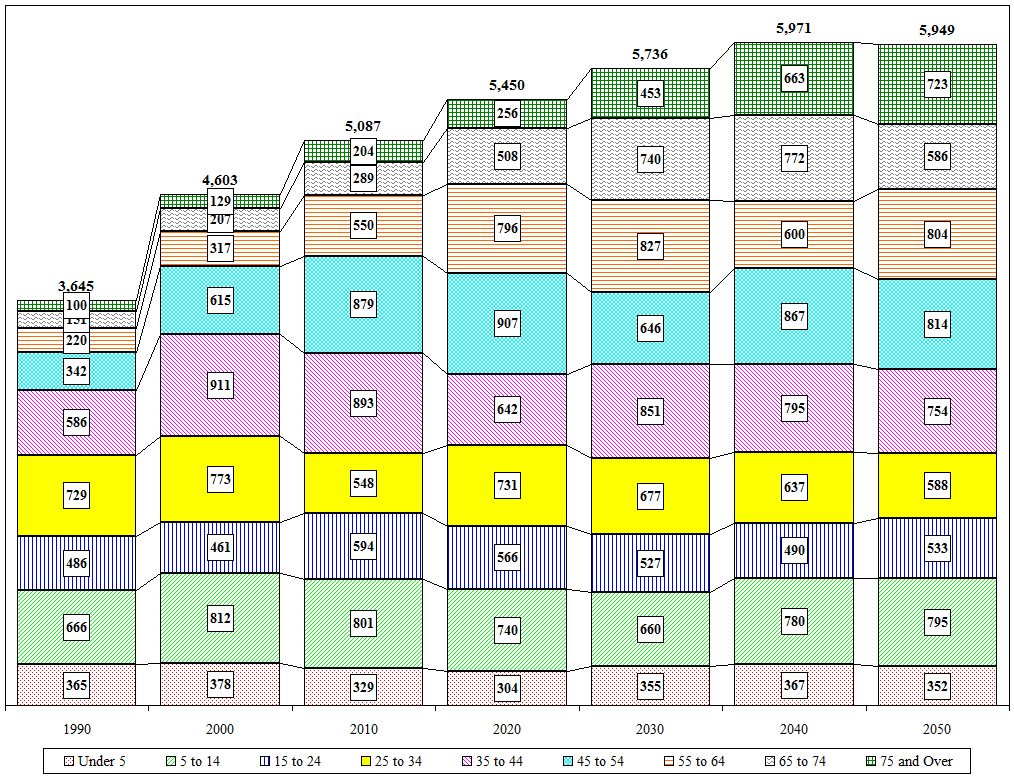
Town of Northumberland Age Cohort Projections
| Value |
Historic |
Projected |
| 1990 |
2000 |
2010 |
2020 |
2030 |
2040 |
2050 |
| Total |
3,645 |
4,603 |
5,087 |
5,450 |
5,736 |
5,971 |
5,949 |
| Under 5 |
365 |
378 |
329 |
304 |
355 |
367 |
352 |
| 5 to 14 |
666 |
812 |
801 |
740 |
660 |
780 |
795 |
| 15 to 24 |
486 |
461 |
594 |
566 |
527 |
490 |
533 |
| 25 to 34 |
729 |
773 |
548 |
731 |
677 |
637 |
588 |
| 35 to 44 |
586 |
911 |
893 |
642 |
851 |
795 |
754 |
| 45 to 54 |
342 |
615 |
879 |
907 |
646 |
867 |
814 |
| 55 to 64 |
220 |
317 |
550 |
796 |
827 |
600 |
804 |
| 65 to 74 |
151 |
207 |
289 |
508 |
740 |
772 |
586 |
| 75 and Over |
100 |
129 |
204 |
256 |
453 |
663 |
723 |
| Distribution |
1990 |
2000 |
2010 |
2020 |
2030 |
2040 |
2050 |
| Under 5 |
10.0% |
8.2% |
6.5% |
5.6% |
6.2% |
6.1% |
5.9% |
| 5 to 14 |
18.3% |
17.6% |
15.7% |
13.6% |
11.5% |
13.1% |
13.4% |
| 15 to 24 |
13.3% |
10.0% |
11.7% |
10.4% |
9.2% |
8.2% |
9.0% |
| 25 to 34 |
20.0% |
16.8% |
10.8% |
13.4% |
11.8% |
10.7% |
9.9% |
| 35 to 44 |
16.1% |
19.8% |
17.6% |
11.8% |
14.8% |
13.3% |
12.7% |
| 45 to 54 |
9.4% |
13.4% |
17.3% |
16.6% |
11.3% |
14.5% |
13.7% |
| 55 to 64 |
6.0% |
6.9% |
10.8% |
14.6% |
14.4% |
10.0% |
13.5% |
| 65 to 74 |
4.1% |
4.5% |
5.7% |
9.3% |
12.9% |
12.9% |
9.9% |
| 75 and Over |
2.7% |
2.8% |
4.0% |
4.7% |
7.9% |
11.1% |
12.2% |

Close

