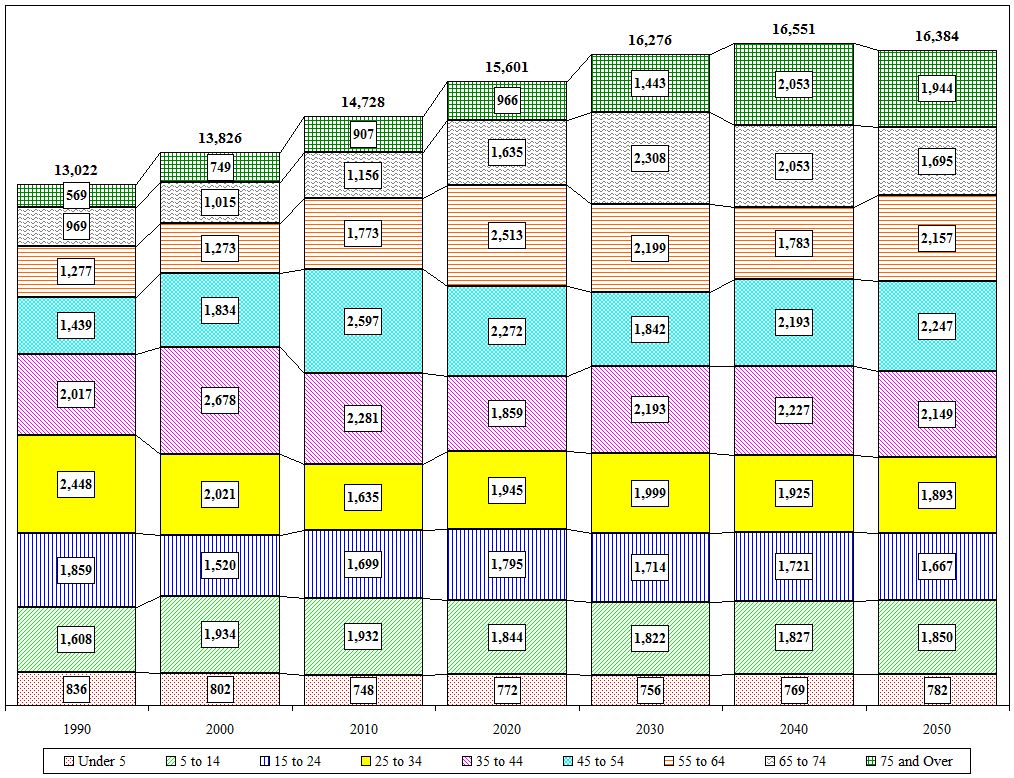
Town of Moreau Age Cohort Projections
| Value |
Historic |
Projected |
| Village Values Included |
1990 |
2000 |
2010 |
2020 |
2030 |
2040 |
2050 |
| Total |
13,022 |
13,826 |
14,728 |
15,601 |
16,276 |
16,551 |
16,384 |
| Under 5 |
836 |
802 |
748 |
772 |
756 |
769 |
782 |
| 5 to 14 |
1,608 |
1,934 |
1,932 |
1,844 |
1,822 |
1,827 |
1,850 |
| 15 to 24 |
1,859 |
1,520 |
1,699 |
1,795 |
1,714 |
1,721 |
1,667 |
| 25 to 34 |
2,448 |
2,021 |
1,635 |
1,945 |
1,999 |
1,925 |
1,893 |
| 35 to 44 |
2,017 |
2,678 |
2,281 |
1,859 |
2,193 |
2,227 |
2,149 |
| 45 to 54 |
1,439 |
1,834 |
2,597 |
2,272 |
1,842 |
2,193 |
2,247 |
| 55 to 64 |
1,277 |
1,273 |
1,773 |
2,513 |
2,199 |
1,783 |
2,157 |
| 65 to 74 |
969 |
1,015 |
1,156 |
1,635 |
2,308 |
2,053 |
1,695 |
| 75 and Over |
569 |
749 |
907 |
966 |
1,443 |
2,053 |
1,944 |
| Distribution |
1990 |
2000 |
2010 |
2020 |
2030 |
2040 |
2050 |
| Under 5 |
6.4% |
5.8% |
5.1% |
4.9% |
4.6% |
4.6% |
4.8% |
| 5 to 14 |
12.3% |
14.0% |
13.1% |
11.8% |
11.2% |
11.0% |
11.3% |
| 15 to 24 |
14.3% |
11.0% |
11.5% |
11.5% |
10.5% |
10.4% |
10.2% |
| 25 to 34 |
18.8% |
14.6% |
11.1% |
12.5% |
12.3% |
11.6% |
11.6% |
| 35 to 44 |
15.5% |
19.4% |
15.5% |
11.9% |
13.5% |
13.5% |
13.1% |
| 45 to 54 |
11.1% |
13.3% |
17.6% |
14.6% |
11.3% |
13.2% |
13.7% |
| 55 to 64 |
9.8% |
9.2% |
12.0% |
16.1% |
13.5% |
10.8% |
13.2% |
| 65 to 74 |
7.4% |
7.3% |
7.8% |
10.5% |
14.2% |
12.4% |
10.3% |
| 75 and Over |
4.4% |
5.4% |
6.2% |
6.2% |
8.9% |
12.4% |
11.9% |

Close

