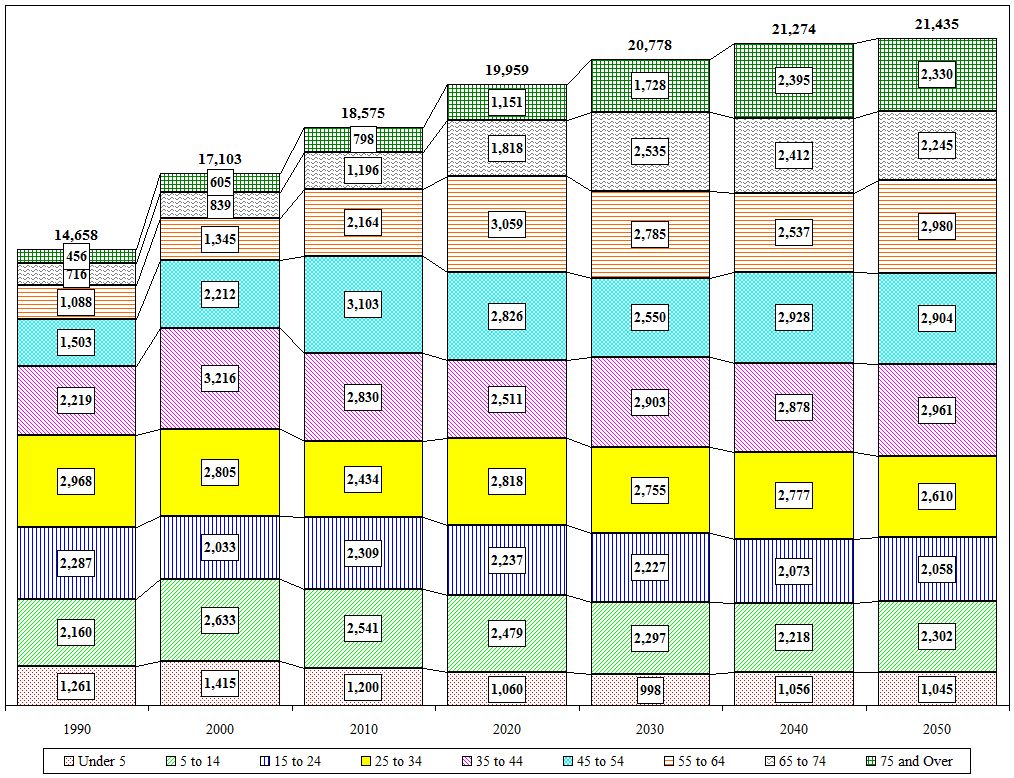
Town of Milton Age Cohort Projections
| Value |
Historic |
Projected |
| Village Values Included |
1990 |
2000 |
2010 |
2020 |
2030 |
2040 |
2050 |
| Total |
14,658 |
17,103 |
18,575 |
19,959 |
20,778 |
21,274 |
21,435 |
| Under 5 |
1,261 |
1,415 |
1,200 |
1,060 |
998 |
1,056 |
1,045 |
| 5 to 14 |
2,160 |
2,633 |
2,541 |
2,479 |
2,297 |
2,218 |
2,302 |
| 15 to 24 |
2,287 |
2,033 |
2,309 |
2,237 |
2,227 |
2,073 |
2,058 |
| 25 to 34 |
2,968 |
2,805 |
2,434 |
2,818 |
2,755 |
2,777 |
2,610 |
| 35 to 44 |
2,219 |
3,216 |
2,830 |
2,511 |
2,903 |
2,878 |
2,961 |
| 45 to 54 |
1,503 |
2,212 |
3,103 |
2,826 |
2,550 |
2,928 |
2,904 |
| 55 to 64 |
1,088 |
1,345 |
2,164 |
3,059 |
2,785 |
2,537 |
2,980 |
| 65 to 74 |
716 |
839 |
1,196 |
1,818 |
2,535 |
2,412 |
2,245 |
| 75 and Over |
456 |
605 |
798 |
1,151 |
1,728 |
2,395 |
2,330 |
| Distribution |
1990 |
2000 |
2010 |
2020 |
2030 |
2040 |
2050 |
| Under 5 |
8.6% |
8.3% |
6.5% |
5.3% |
4.8% |
5.0% |
4.9% |
| 5 to 14 |
14.7% |
15.4% |
13.7% |
12.4% |
11.1% |
10.4% |
10.7% |
| 15 to 24 |
15.6% |
11.9% |
12.4% |
11.2% |
10.7% |
9.7% |
9.6% |
| 25 to 34 |
20.2% |
16.4% |
13.1% |
14.1% |
13.3% |
13.1% |
12.2% |
| 35 to 44 |
15.1% |
18.8% |
15.2% |
12.6% |
14.0% |
13.5% |
13.8% |
| 45 to 54 |
10.3% |
12.9% |
16.7% |
14.2% |
12.3% |
13.8% |
13.5% |
| 55 to 64 |
7.4% |
7.9% |
11.7% |
15.3% |
13.4% |
11.9% |
13.9% |
| 65 to 74 |
4.9% |
4.9% |
6.4% |
9.1% |
12.2% |
11.3% |
10.5% |
| 75 and Over |
3.1% |
3.5% |
4.3% |
5.8% |
8.3% |
11.3% |
10.9% |

Close

