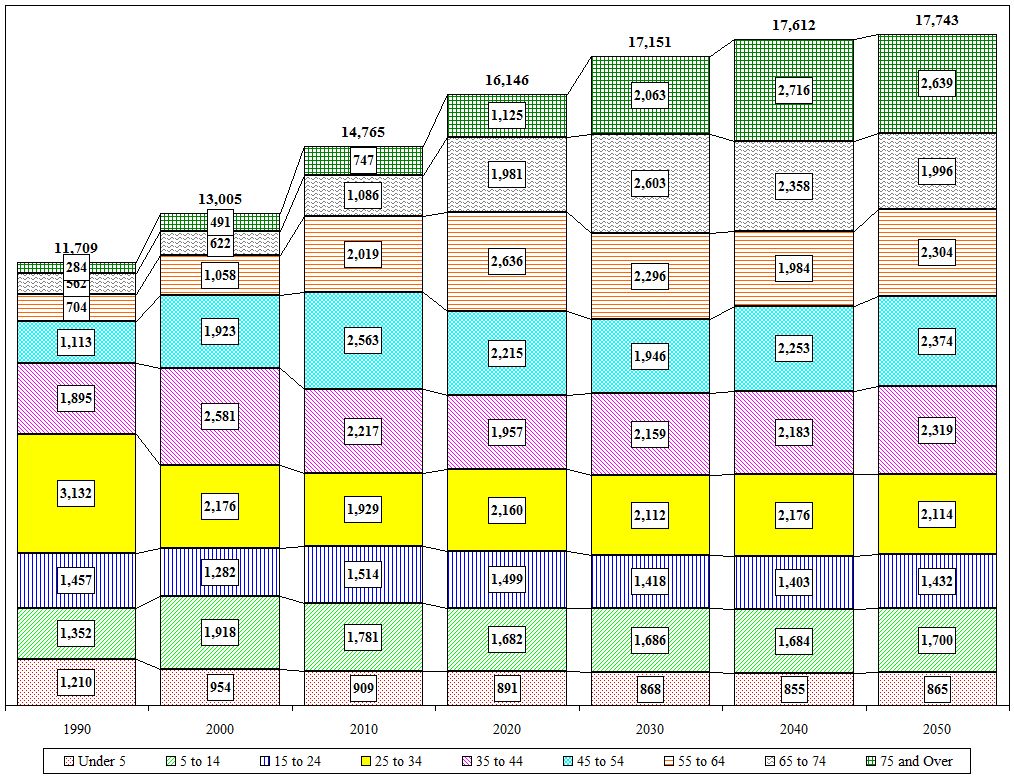
Town of Malta Age Cohort Projections
| Value |
Historic |
Projected |
| Village Values Included |
1990 |
2000 |
2010 |
2020 |
2030 |
2040 |
2050 |
| Total |
11,709 |
13,005 |
14,765 |
16,146 |
17,151 |
17,612 |
17,743 |
| Under 5 |
1,210 |
954 |
909 |
891 |
868 |
855 |
865 |
| 5 to 14 |
1,352 |
1,918 |
1,781 |
1,682 |
1,686 |
1,684 |
1,700 |
| 15 to 24 |
1,457 |
1,282 |
1,514 |
1,499 |
1,418 |
1,403 |
1,432 |
| 25 to 34 |
3,132 |
2,176 |
1,929 |
2,160 |
2,112 |
2,176 |
2,114 |
| 35 to 44 |
1,895 |
2,581 |
2,217 |
1,957 |
2,159 |
2,183 |
2,319 |
| 45 to 54 |
1,113 |
1,923 |
2,563 |
2,215 |
1,946 |
2,253 |
2,374 |
| 55 to 64 |
704 |
1,058 |
2,019 |
2,636 |
2,296 |
1,984 |
2,304 |
| 65 to 74 |
562 |
622 |
1,086 |
1,981 |
2,603 |
2,358 |
1,996 |
| 75 and Over |
284 |
491 |
747 |
1,125 |
2,063 |
2,716 |
2,639 |
| Distribution |
1990 |
2000 |
2010 |
2020 |
2030 |
2040 |
2050 |
| Under 5 |
10.3% |
7.3% |
6.2% |
5.5% |
5.1% |
4.9% |
4.9% |
| 5 to 14 |
11.5% |
14.7% |
12.1% |
10.4% |
9.8% |
9.6% |
9.6% |
| 15 to 24 |
12.4% |
9.9% |
10.3% |
9.3% |
8.3% |
8.0% |
8.1% |
| 25 to 34 |
26.7% |
16.7% |
13.1% |
13.4% |
12.3% |
12.4% |
11.9% |
| 35 to 44 |
16.2% |
19.8% |
15.0% |
12.1% |
12.6% |
12.4% |
13.1% |
| 45 to 54 |
9.5% |
14.8% |
17.4% |
13.7% |
11.3% |
12.8% |
13.4% |
| 55 to 64 |
6.0% |
8.1% |
13.7% |
16.3% |
13.4% |
11.3% |
13.0% |
| 65 to 74 |
4.8% |
4.8% |
7.4% |
12.3% |
15.2% |
13.4% |
11.2% |
| 75 and Over |
2.4% |
3.8% |
5.1% |
7.0% |
12.0% |
15.4% |
14.9% |

Close

