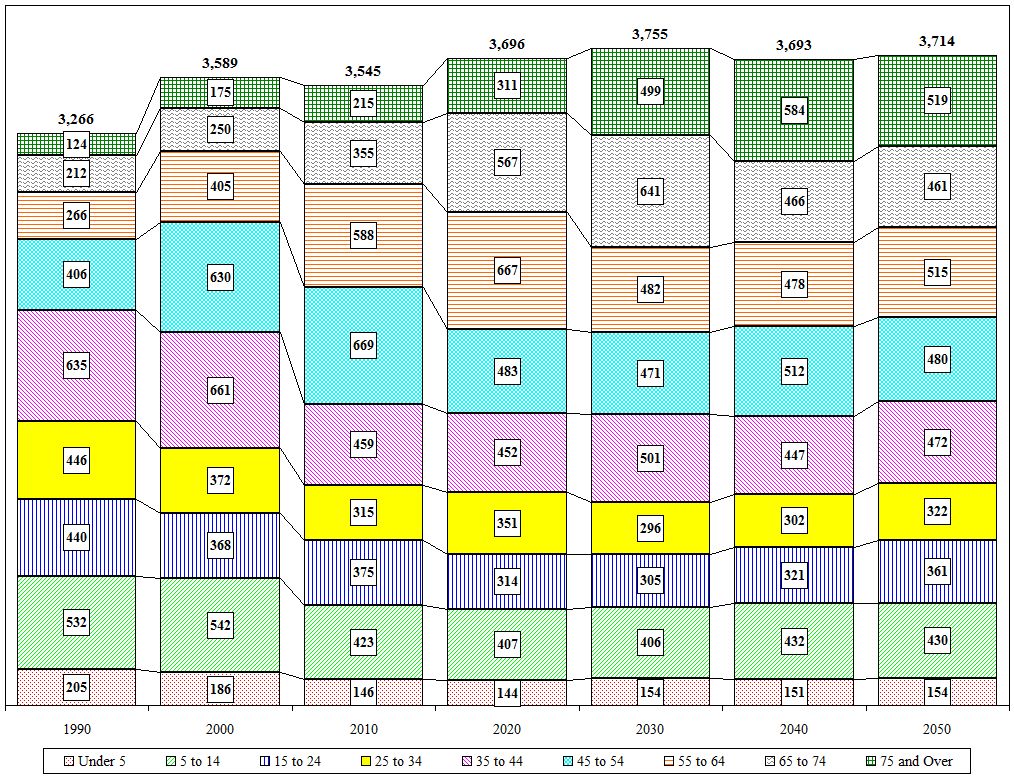
Town of Galway Age Cohort Projections
| Value |
Historic |
Projected |
| Village Values Included |
1990 |
2000 |
2010 |
2020 |
2030 |
2040 |
2050 |
| Total |
3,266 |
3,589 |
3,545 |
3,696 |
3,755 |
3,693 |
3,714 |
| Under 5 |
205 |
186 |
146 |
144 |
154 |
151 |
154 |
| 5 to 14 |
532 |
542 |
423 |
407 |
406 |
432 |
430 |
| 15 to 24 |
440 |
368 |
375 |
314 |
305 |
321 |
361 |
| 25 to 34 |
446 |
372 |
315 |
351 |
296 |
302 |
322 |
| 35 to 44 |
635 |
661 |
459 |
452 |
501 |
447 |
472 |
| 45 to 54 |
406 |
630 |
669 |
483 |
471 |
512 |
480 |
| 55 to 64 |
266 |
405 |
588 |
667 |
482 |
478 |
515 |
| 65 to 74 |
212 |
250 |
355 |
567 |
641 |
466 |
461 |
| 75 and Over |
124 |
175 |
215 |
311 |
499 |
584 |
519 |
| Distribution |
1990 |
2000 |
2010 |
2020 |
2030 |
2040 |
2050 |
| Under 5 |
6.3% |
5.2% |
4.1% |
3.9% |
4.1% |
4.1% |
4.1% |
| 5 to 14 |
16.3% |
15.1% |
11.9% |
11.0% |
10.8% |
11.7% |
11.6% |
| 15 to 24 |
13.5% |
10.3% |
10.6% |
8.5% |
8.1% |
8.7% |
9.7% |
| 25 to 34 |
13.7% |
10.4% |
8.9% |
9.5% |
7.9% |
8.2% |
8.7% |
| 35 to 44 |
19.4% |
18.4% |
12.9% |
12.2% |
13.3% |
12.1% |
12.7% |
| 45 to 54 |
12.4% |
17.6% |
18.9% |
13.1% |
12.5% |
13.9% |
12.9% |
| 55 to 64 |
8.1% |
11.3% |
16.6% |
18.0% |
12.8% |
12.9% |
13.9% |
| 65 to 74 |
6.5% |
7.0% |
10.0% |
15.3% |
17.1% |
12.6% |
12.4% |
| 75 and Over |
3.8% |
4.9% |
6.1% |
8.4% |
13.3% |
15.8% |
14.0% |

Close

