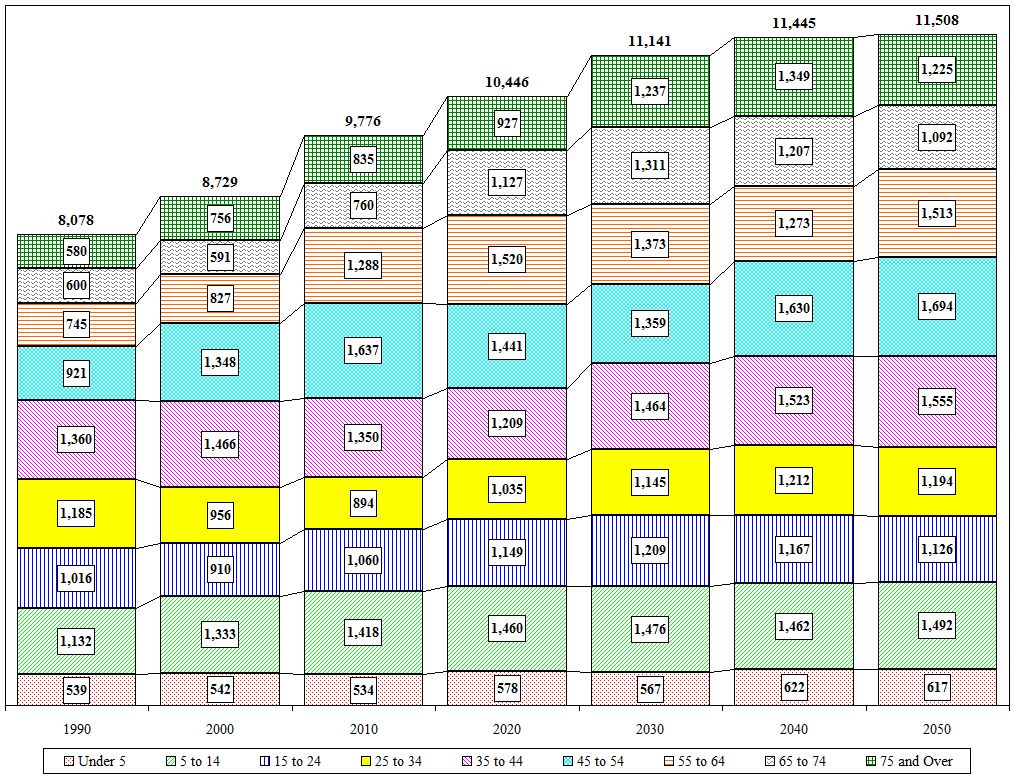
Town of Ballston Age Cohort Projections
| Value |
Historic |
Projected |
| Village Values Included |
1990 |
2000 |
2010 |
2020 |
2030 |
2040 |
2050 |
| Total |
8,078 |
8,729 |
9,776 |
10,446 |
11,141 |
11,445 |
11,508 |
| Under 5 |
539 |
542 |
534 |
578 |
567 |
622 |
617 |
| 5 to 14 |
1,132 |
1,333 |
1,418 |
1,460 |
1,476 |
1,462 |
1,492 |
| 15 to 24 |
1,016 |
910 |
1,060 |
1,149 |
1,209 |
1,167 |
1,126 |
| 25 to 34 |
1,185 |
956 |
894 |
1,035 |
1,145 |
1,212 |
1,194 |
| 35 to 44 |
1,360 |
1,466 |
1,350 |
1,209 |
1,464 |
1,523 |
1,555 |
| 45 to 54 |
921 |
1,348 |
1,637 |
1,441 |
1,359 |
1,630 |
1,694 |
| 55 to 64 |
745 |
827 |
1,288 |
1,520 |
1,373 |
1,273 |
1,513 |
| 65 to 74 |
600 |
591 |
760 |
1,127 |
1,311 |
1,207 |
1,092 |
| 75 and Over |
580 |
756 |
835 |
927 |
1,237 |
1,349 |
1,225 |
| Distribution |
1990 |
2000 |
2010 |
2020 |
2030 |
2040 |
2050 |
| Under 5 |
6.7% |
6.2% |
5.5% |
5.5% |
5.1% |
5.4% |
5.4% |
| 5 to 14 |
14.0% |
15.3% |
14.5% |
14.0% |
13.2% |
12.8% |
13.0% |
| 15 to 24 |
12.6% |
10.4% |
10.8% |
11.0% |
10.9% |
10.2% |
9.8% |
| 25 to 34 |
14.7% |
11.0% |
9.1% |
9.9% |
10.3% |
10.6% |
10.4% |
| 35 to 44 |
16.8% |
16.8% |
13.8% |
11.6% |
13.1% |
13.3% |
13.5% |
| 45 to 54 |
11.4% |
15.4% |
16.7% |
13.8% |
12.2% |
14.2% |
14.7% |
| 55 to 64 |
9.2% |
9.5% |
13.2% |
14.6% |
12.3% |
11.1% |
13.1% |
| 65 to 74 |
7.4% |
6.8% |
7.8% |
10.8% |
11.8% |
10.5% |
9.5% |
| 75 and Over |
7.2% |
8.7% |
8.5% |
8.9% |
11.1% |
11.8% |
10.6% |

Close

