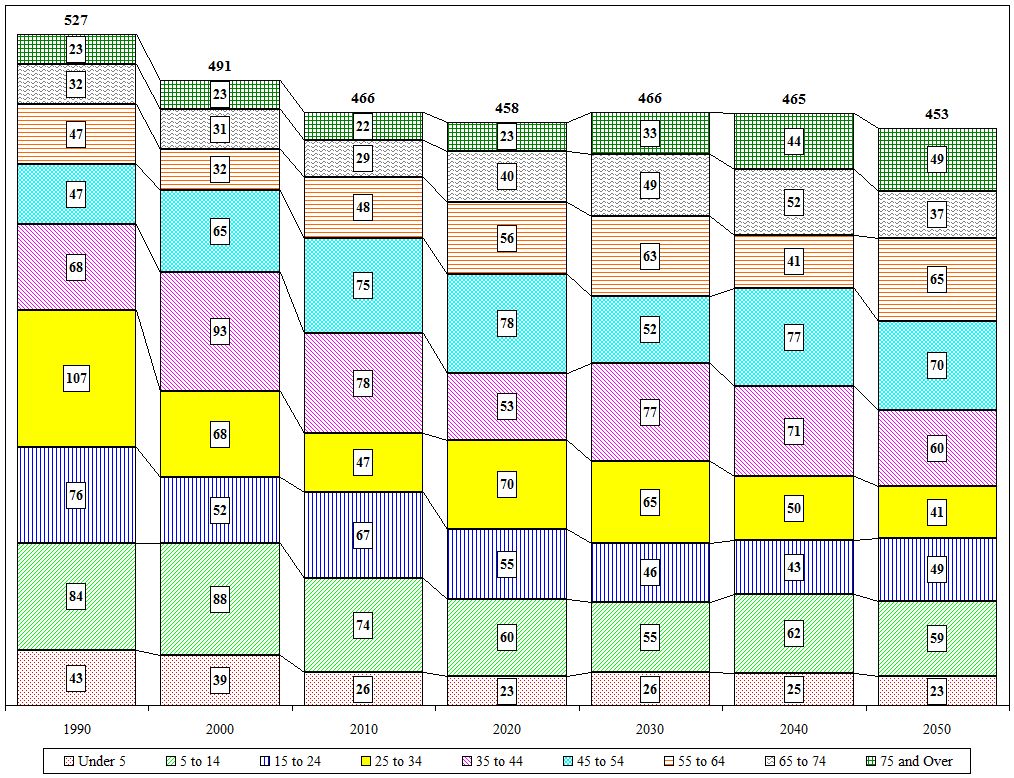
Village of Valley Falls (all) Age Cohort Projections
| Value |
Historic |
Projected |
| 1990 |
2000 |
2010 |
2020 |
2030 |
2040 |
2050 |
| Total |
527 |
491 |
466 |
458 |
466 |
465 |
453 |
| Under 5 |
43 |
39 |
26 |
23 |
26 |
25 |
23 |
| 5 to 14 |
84 |
88 |
74 |
60 |
55 |
62 |
59 |
| 15 to 24 |
76 |
52 |
67 |
55 |
46 |
43 |
49 |
| 25 to 34 |
107 |
68 |
47 |
70 |
65 |
50 |
41 |
| 35 to 44 |
68 |
93 |
78 |
53 |
77 |
71 |
60 |
| 45 to 54 |
47 |
65 |
75 |
78 |
52 |
77 |
70 |
| 55 to 64 |
47 |
32 |
48 |
56 |
63 |
41 |
65 |
| 65 to 74 |
32 |
31 |
29 |
40 |
49 |
52 |
37 |
| 75 and Over |
23 |
23 |
22 |
23 |
33 |
44 |
49 |
| Distribution |
1990 |
2000 |
2010 |
2020 |
2030 |
2040 |
2050 |
| Under 5 |
8.2% |
7.9% |
5.6% |
5.0% |
5.6% |
5.4% |
5.1% |
| 5 to 14 |
15.9% |
17.9% |
15.9% |
13.1% |
11.8% |
13.3% |
13.0% |
| 15 to 24 |
14.4% |
10.6% |
14.4% |
12.0% |
9.9% |
9.2% |
10.8% |
| 25 to 34 |
20.3% |
13.8% |
10.1% |
15.3% |
13.9% |
10.8% |
9.1% |
| 35 to 44 |
12.9% |
18.9% |
16.7% |
11.6% |
16.5% |
15.3% |
13.2% |
| 45 to 54 |
8.9% |
13.2% |
16.1% |
17.0% |
11.2% |
16.6% |
15.5% |
| 55 to 64 |
8.9% |
6.5% |
10.3% |
12.2% |
13.5% |
8.8% |
14.3% |
| 65 to 74 |
6.1% |
6.3% |
6.2% |
8.7% |
10.5% |
11.2% |
8.2% |
| 75 and Over |
4.4% |
4.7% |
4.7% |
5.0% |
7.1% |
9.5% |
10.8% |

Close

