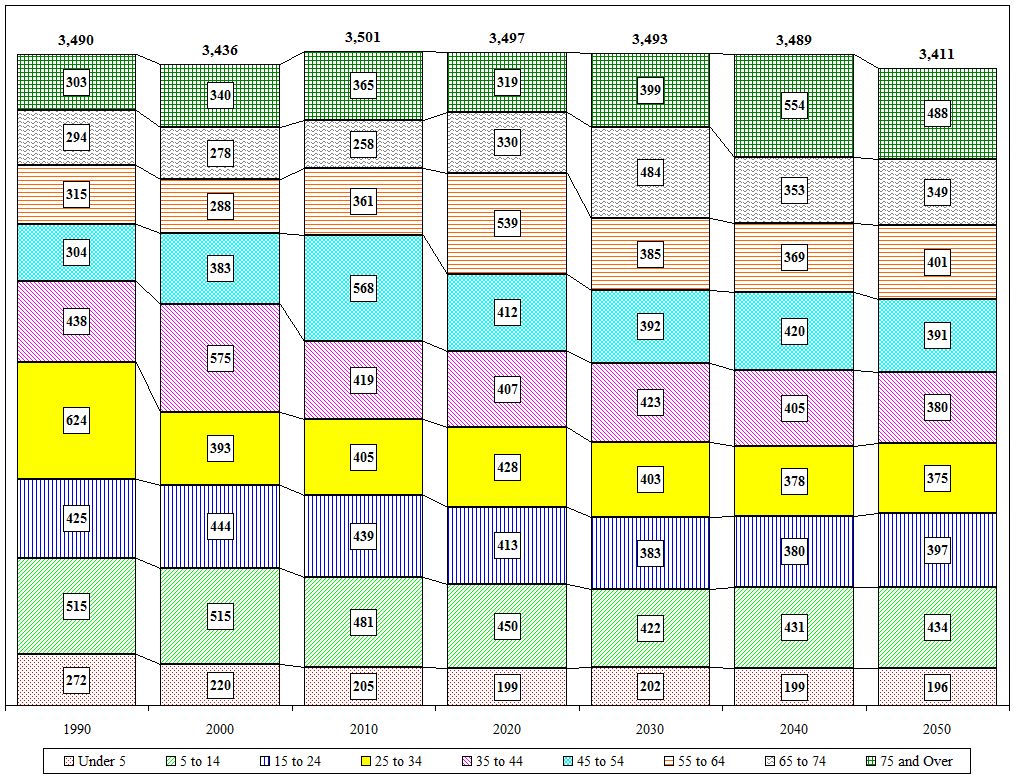
Village of Hoosick Falls Age Cohort Projections
| Value |
Historic |
Projected |
| 1990 |
2000 |
2010 |
2020 |
2030 |
2040 |
2050 |
| Total |
3,490 |
3,436 |
3,501 |
3,497 |
3,493 |
3,489 |
3,411 |
| Under 5 |
272 |
220 |
205 |
199 |
202 |
199 |
196 |
| 5 to 14 |
515 |
515 |
481 |
450 |
422 |
431 |
434 |
| 15 to 24 |
425 |
444 |
439 |
413 |
383 |
380 |
397 |
| 25 to 34 |
624 |
393 |
405 |
428 |
403 |
378 |
375 |
| 35 to 44 |
438 |
575 |
419 |
407 |
423 |
405 |
380 |
| 45 to 54 |
304 |
383 |
568 |
412 |
392 |
420 |
391 |
| 55 to 64 |
315 |
288 |
361 |
539 |
385 |
369 |
401 |
| 65 to 74 |
294 |
278 |
258 |
330 |
484 |
353 |
349 |
| 75 and Over |
303 |
340 |
365 |
319 |
399 |
554 |
488 |
| Distribution |
1990 |
2000 |
2010 |
2020 |
2030 |
2040 |
2050 |
| Under 5 |
7.8% |
6.4% |
5.9% |
5.7% |
5.8% |
5.7% |
5.7% |
| 5 to 14 |
14.8% |
15.0% |
13.7% |
12.9% |
12.1% |
12.4% |
12.7% |
| 15 to 24 |
12.2% |
12.9% |
12.5% |
11.8% |
11.0% |
10.9% |
11.6% |
| 25 to 34 |
17.9% |
11.4% |
11.6% |
12.2% |
11.5% |
10.8% |
11.0% |
| 35 to 44 |
12.6% |
16.7% |
12.0% |
11.6% |
12.1% |
11.6% |
11.1% |
| 45 to 54 |
8.7% |
11.1% |
16.2% |
11.8% |
11.2% |
12.0% |
11.5% |
| 55 to 64 |
9.0% |
8.4% |
10.3% |
15.4% |
11.0% |
10.6% |
11.8% |
| 65 to 74 |
8.4% |
8.1% |
7.4% |
9.4% |
13.9% |
10.1% |
10.2% |
| 75 and Over |
8.7% |
9.9% |
10.4% |
9.1% |
11.4% |
15.9% |
14.3% |

Close

