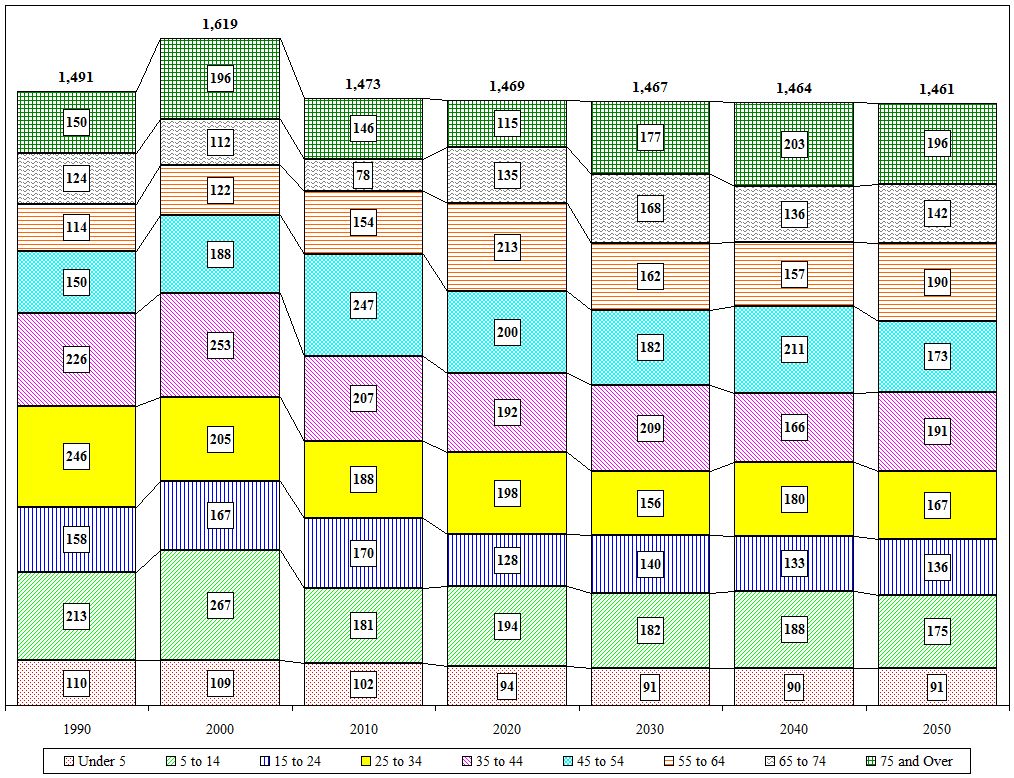
Village of Castleton-on-Hudson Age Cohort Projections
| Value |
Historic |
Projected |
| 1990 |
2000 |
2010 |
2020 |
2030 |
2040 |
2050 |
| Total |
1,491 |
1,619 |
1,473 |
1,469 |
1,467 |
1,464 |
1,461 |
| Under 5 |
110 |
109 |
102 |
94 |
91 |
90 |
91 |
| 5 to 14 |
213 |
267 |
181 |
194 |
182 |
188 |
175 |
| 15 to 24 |
158 |
167 |
170 |
128 |
140 |
133 |
136 |
| 25 to 34 |
246 |
205 |
188 |
198 |
156 |
180 |
167 |
| 35 to 44 |
226 |
253 |
207 |
192 |
209 |
166 |
191 |
| 45 to 54 |
150 |
188 |
247 |
200 |
182 |
211 |
173 |
| 55 to 64 |
114 |
122 |
154 |
213 |
162 |
157 |
190 |
| 65 to 74 |
124 |
112 |
78 |
135 |
168 |
136 |
142 |
| 75 and Over |
150 |
196 |
146 |
115 |
177 |
203 |
196 |
| Distribution |
1990 |
2000 |
2010 |
2020 |
2030 |
2040 |
2050 |
| Under 5 |
7.4% |
6.7% |
6.9% |
6.4% |
6.2% |
6.1% |
6.2% |
| 5 to 14 |
14.3% |
16.5% |
12.3% |
13.2% |
12.4% |
12.8% |
12.0% |
| 15 to 24 |
10.6% |
10.3% |
11.5% |
8.7% |
9.5% |
9.1% |
9.3% |
| 25 to 34 |
16.5% |
12.7% |
12.8% |
13.5% |
10.6% |
12.3% |
11.4% |
| 35 to 44 |
15.2% |
15.6% |
14.1% |
13.1% |
14.2% |
11.3% |
13.1% |
| 45 to 54 |
10.1% |
11.6% |
16.8% |
13.6% |
12.4% |
14.4% |
11.8% |
| 55 to 64 |
7.6% |
7.5% |
10.5% |
14.5% |
11.0% |
10.7% |
13.0% |
| 65 to 74 |
8.3% |
6.9% |
5.3% |
9.2% |
11.5% |
9.3% |
9.7% |
| 75 and Over |
10.1% |
12.1% |
9.9% |
7.8% |
12.1% |
13.9% |
13.4% |

Close

