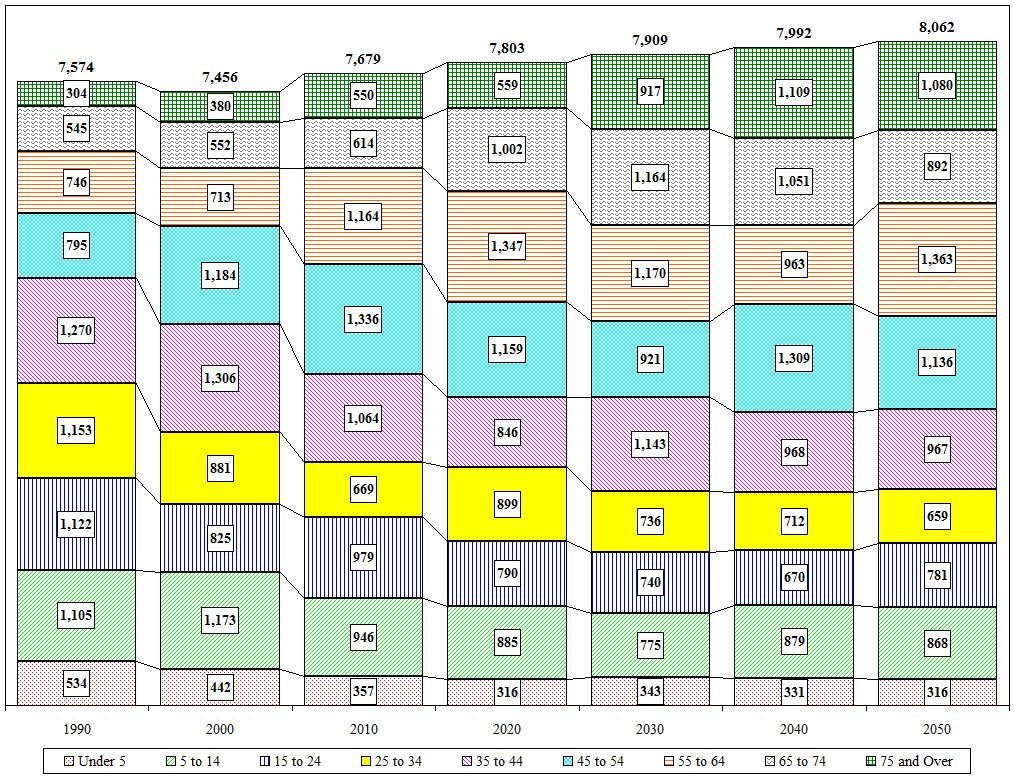
Town of Schaghticoke Age Cohort Projections
| Value |
Historic |
Projected |
| Village Values Included |
1990 |
2000 |
2010 |
2020 |
2030 |
2040 |
2050 |
| Total |
7,574 |
7,456 |
7,679 |
7,803 |
7,909 |
7,992 |
8,062 |
| Under 5 |
534 |
442 |
357 |
316 |
343 |
331 |
316 |
| 5 to 14 |
1,105 |
1,173 |
946 |
885 |
775 |
879 |
868 |
| 15 to 24 |
1,122 |
825 |
979 |
790 |
740 |
670 |
781 |
| 25 to 34 |
1,153 |
881 |
669 |
899 |
736 |
712 |
659 |
| 35 to 44 |
1,270 |
1,306 |
1,064 |
846 |
1,143 |
968 |
967 |
| 45 to 54 |
795 |
1,184 |
1,336 |
1,159 |
921 |
1,309 |
1,136 |
| 55 to 64 |
746 |
713 |
1,164 |
1,347 |
1,170 |
963 |
1,363 |
| 65 to 74 |
545 |
552 |
614 |
1,002 |
1,164 |
1,051 |
892 |
| 75 and Over |
304 |
380 |
550 |
559 |
917 |
1,109 |
1,080 |
| Distribution |
1990 |
2000 |
2010 |
2020 |
2030 |
2040 |
2050 |
| Under 5 |
7.1% |
5.9% |
4.6% |
4.0% |
4.3% |
4.1% |
3.9% |
| 5 to 14 |
14.6% |
15.7% |
12.3% |
11.3% |
9.8% |
11.0% |
10.8% |
| 15 to 24 |
14.8% |
11.1% |
12.7% |
10.1% |
9.4% |
8.4% |
9.7% |
| 25 to 34 |
15.2% |
11.8% |
8.7% |
11.5% |
9.3% |
8.9% |
8.2% |
| 35 to 44 |
16.8% |
17.5% |
13.9% |
10.8% |
14.5% |
12.1% |
12.0% |
| 45 to 54 |
10.5% |
15.9% |
17.4% |
14.9% |
11.6% |
16.4% |
14.1% |
| 55 to 64 |
9.8% |
9.6% |
15.2% |
17.3% |
14.8% |
12.0% |
16.9% |
| 65 to 74 |
7.2% |
7.4% |
8.0% |
12.8% |
14.7% |
13.2% |
11.1% |
| 75 and Over |
4.0% |
5.1% |
7.2% |
7.2% |
11.6% |
13.9% |
13.4% |

Close

