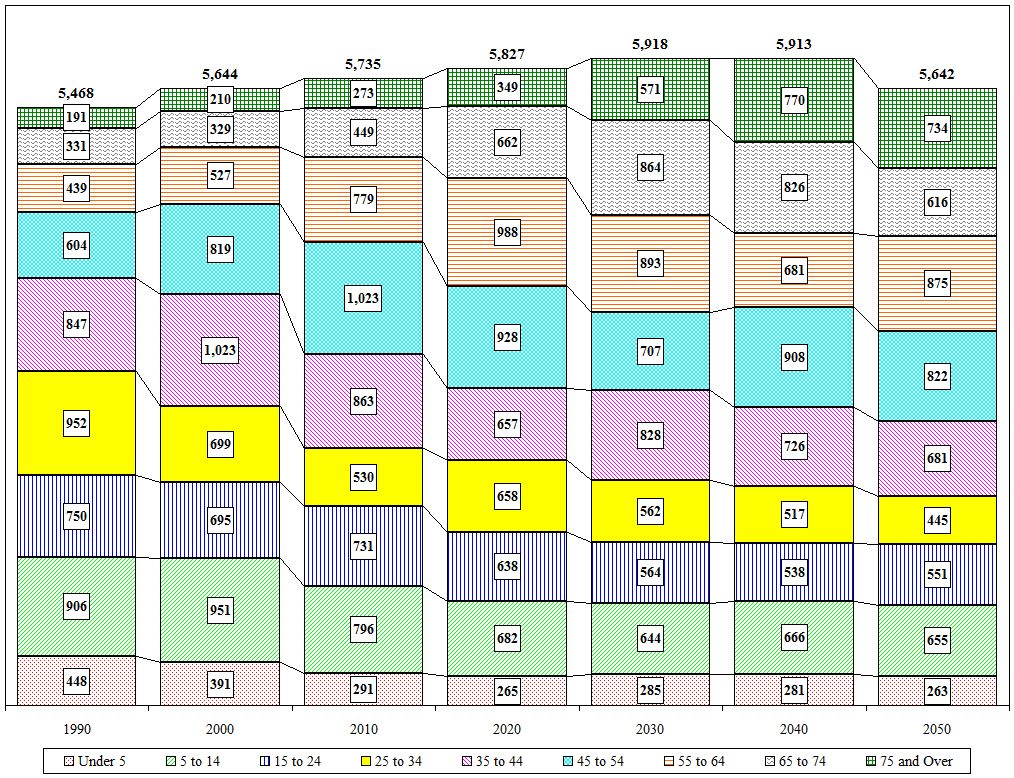
Town of Pittstown Age Cohort Projections
| Value |
Historic |
Projected |
| Village Values Included |
1990 |
2000 |
2010 |
2020 |
2030 |
2040 |
2050 |
| Total |
5,468 |
5,644 |
5,735 |
5,827 |
5,918 |
5,913 |
5,642 |
| Under 5 |
448 |
391 |
291 |
265 |
285 |
281 |
263 |
| 5 to 14 |
906 |
951 |
796 |
682 |
644 |
666 |
655 |
| 15 to 24 |
750 |
695 |
731 |
638 |
564 |
538 |
551 |
| 25 to 34 |
952 |
699 |
530 |
658 |
562 |
517 |
445 |
| 35 to 44 |
847 |
1,023 |
863 |
657 |
828 |
726 |
681 |
| 45 to 54 |
604 |
819 |
1,023 |
928 |
707 |
908 |
822 |
| 55 to 64 |
439 |
527 |
779 |
988 |
893 |
681 |
875 |
| 65 to 74 |
331 |
329 |
449 |
662 |
864 |
826 |
616 |
| 75 and Over |
191 |
210 |
273 |
349 |
571 |
770 |
734 |
| Distribution |
1990 |
2000 |
2010 |
2020 |
2030 |
2040 |
2050 |
| Under 5 |
8.2% |
6.9% |
5.1% |
4.5% |
4.8% |
4.8% |
4.7% |
| 5 to 14 |
16.6% |
16.8% |
13.9% |
11.7% |
10.9% |
11.3% |
11.6% |
| 15 to 24 |
13.7% |
12.3% |
12.7% |
10.9% |
9.5% |
9.1% |
9.8% |
| 25 to 34 |
17.4% |
12.4% |
9.2% |
11.3% |
9.5% |
8.7% |
7.9% |
| 35 to 44 |
15.5% |
18.1% |
15.0% |
11.3% |
14.0% |
12.3% |
12.1% |
| 45 to 54 |
11.0% |
14.5% |
17.8% |
15.9% |
11.9% |
15.4% |
14.6% |
| 55 to 64 |
8.0% |
9.3% |
13.6% |
17.0% |
15.1% |
11.5% |
15.5% |
| 65 to 74 |
6.1% |
5.8% |
7.8% |
11.4% |
14.6% |
14.0% |
10.9% |
| 75 and Over |
3.5% |
3.7% |
4.8% |
6.0% |
9.6% |
13.0% |
13.0% |

Close

