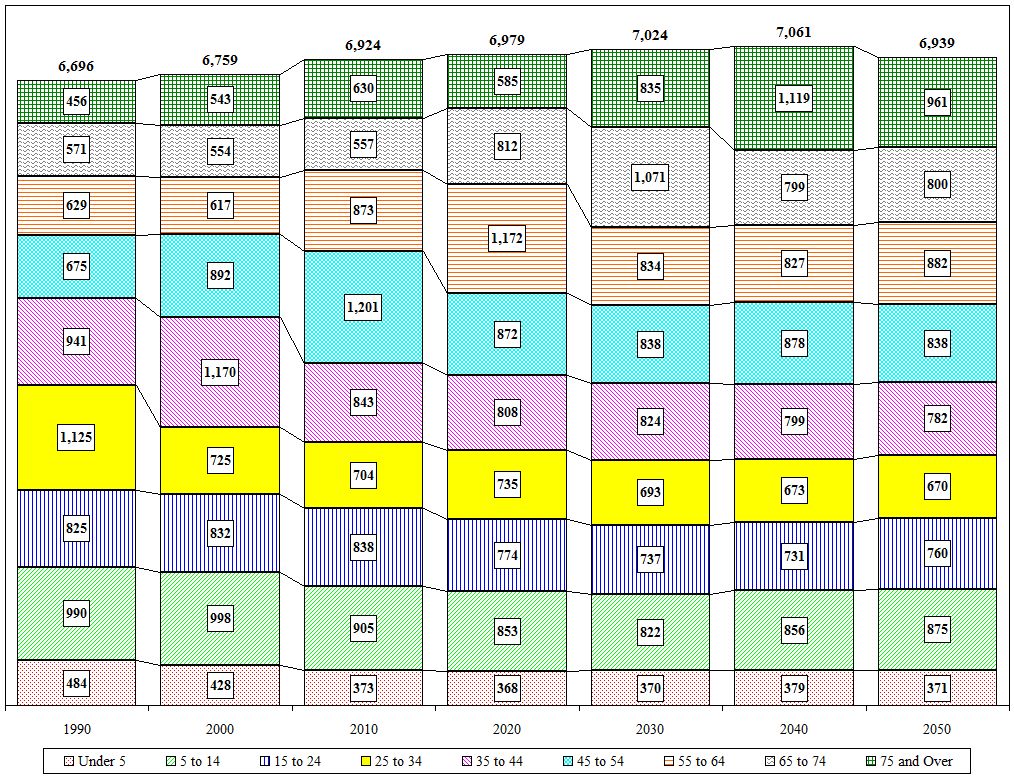
Town of Hoosick Age Cohort Projections
| Value |
Historic |
Projected |
| Village Values Included |
1990 |
2000 |
2010 |
2020 |
2030 |
2040 |
2050 |
| Total |
6,696 |
6,759 |
6,924 |
6,979 |
7,024 |
7,061 |
6,939 |
| Under 5 |
484 |
428 |
373 |
368 |
370 |
379 |
371 |
| 5 to 14 |
990 |
998 |
905 |
853 |
822 |
856 |
875 |
| 15 to 24 |
825 |
832 |
838 |
774 |
737 |
731 |
760 |
| 25 to 34 |
1,125 |
725 |
704 |
735 |
693 |
673 |
670 |
| 35 to 44 |
941 |
1,170 |
843 |
808 |
824 |
799 |
782 |
| 45 to 54 |
675 |
892 |
1,201 |
872 |
838 |
878 |
838 |
| 55 to 64 |
629 |
617 |
873 |
1,172 |
834 |
827 |
882 |
| 65 to 74 |
571 |
554 |
557 |
812 |
1,071 |
799 |
800 |
| 75 and Over |
456 |
543 |
630 |
585 |
835 |
1,119 |
961 |
| Distribution |
1990 |
2000 |
2010 |
2020 |
2030 |
2040 |
2050 |
| Under 5 |
7.2% |
6.3% |
5.4% |
5.3% |
5.3% |
5.4% |
5.3% |
| 5 to 14 |
14.8% |
14.8% |
13.1% |
12.2% |
11.7% |
12.1% |
12.6% |
| 15 to 24 |
12.3% |
12.3% |
12.1% |
11.1% |
10.5% |
10.4% |
11.0% |
| 25 to 34 |
16.8% |
10.7% |
10.2% |
10.5% |
9.9% |
9.5% |
9.7% |
| 35 to 44 |
14.1% |
17.3% |
12.2% |
11.6% |
11.7% |
11.3% |
11.3% |
| 45 to 54 |
10.1% |
13.2% |
17.3% |
12.5% |
11.9% |
12.4% |
12.1% |
| 55 to 64 |
9.4% |
9.1% |
12.6% |
16.8% |
11.9% |
11.7% |
12.7% |
| 65 to 74 |
8.5% |
8.2% |
8.0% |
11.6% |
15.2% |
11.3% |
11.5% |
| 75 and Over |
6.8% |
8.0% |
9.1% |
8.4% |
11.9% |
15.8% |
13.8% |

Close

