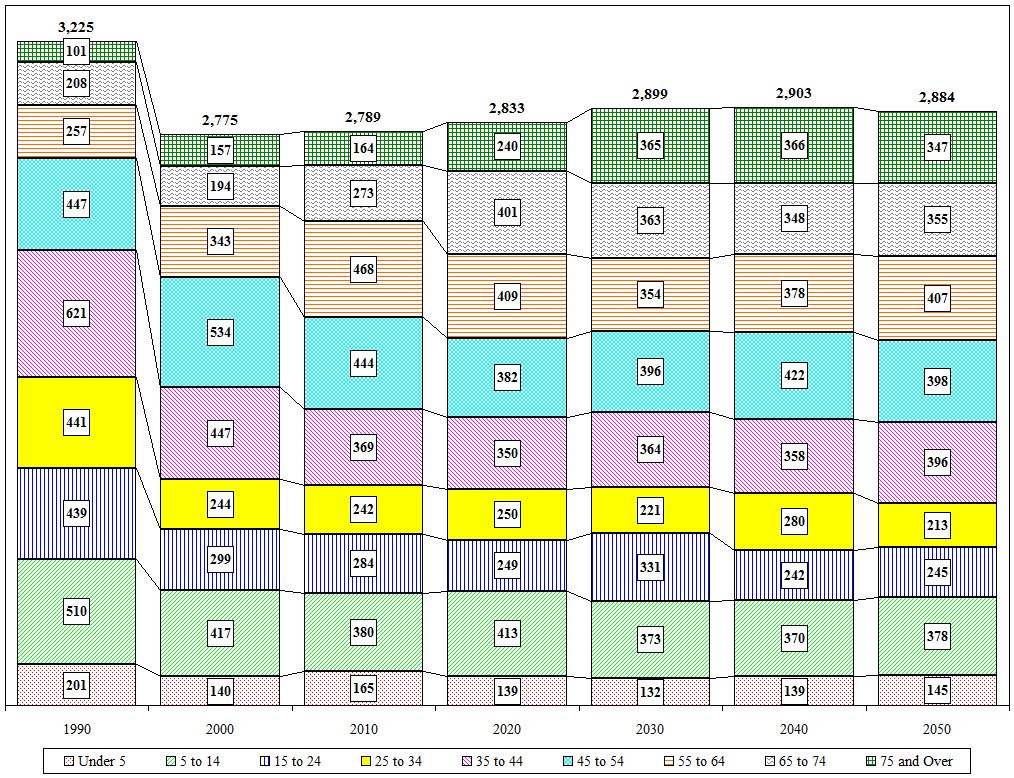
Village of Voorheesville Age Cohort Projections
| Value |
Historic |
Projected |
| 1990 |
2000 |
2010 |
2020 |
2030 |
2040 |
2050 |
| Total |
3,225 |
2,775 |
2,789 |
2,833 |
2,899 |
2,903 |
2,884 |
| Under 5 |
201 |
140 |
165 |
139 |
132 |
139 |
145 |
| 5 to 14 |
510 |
417 |
380 |
413 |
373 |
370 |
378 |
| 15 to 24 |
439 |
299 |
284 |
249 |
331 |
242 |
245 |
| 25 to 34 |
441 |
244 |
242 |
250 |
221 |
280 |
213 |
| 35 to 44 |
621 |
447 |
369 |
350 |
364 |
358 |
396 |
| 45 to 54 |
447 |
534 |
444 |
382 |
396 |
422 |
398 |
| 55 to 64 |
257 |
343 |
468 |
409 |
354 |
378 |
407 |
| 65 to 74 |
208 |
194 |
273 |
401 |
363 |
348 |
355 |
| 75 and Over |
101 |
157 |
164 |
240 |
365 |
366 |
347 |
| Distribution |
1990 |
2000 |
2010 |
2020 |
2030 |
2040 |
2050 |
| Under 5 |
6.2% |
5.0% |
5.9% |
4.9% |
4.6% |
4.8% |
5.0% |
| 5 to 14 |
15.8% |
15.0% |
13.6% |
14.6% |
12.9% |
12.7% |
13.1% |
| 15 to 24 |
13.6% |
10.8% |
10.2% |
8.8% |
11.4% |
8.3% |
8.5% |
| 25 to 34 |
13.7% |
8.8% |
8.7% |
8.8% |
7.6% |
9.6% |
7.4% |
| 35 to 44 |
19.3% |
16.1% |
13.2% |
12.4% |
12.6% |
12.3% |
13.7% |
| 45 to 54 |
13.9% |
19.2% |
15.9% |
13.5% |
13.7% |
14.5% |
13.8% |
| 55 to 64 |
8.0% |
12.4% |
16.8% |
14.4% |
12.2% |
13.0% |
14.1% |
| 65 to 74 |
6.4% |
7.0% |
9.8% |
14.2% |
12.5% |
12.0% |
12.3% |
| 75 and Over |
3.1% |
5.7% |
5.9% |
8.5% |
12.6% |
12.6% |
12.0% |

Close

