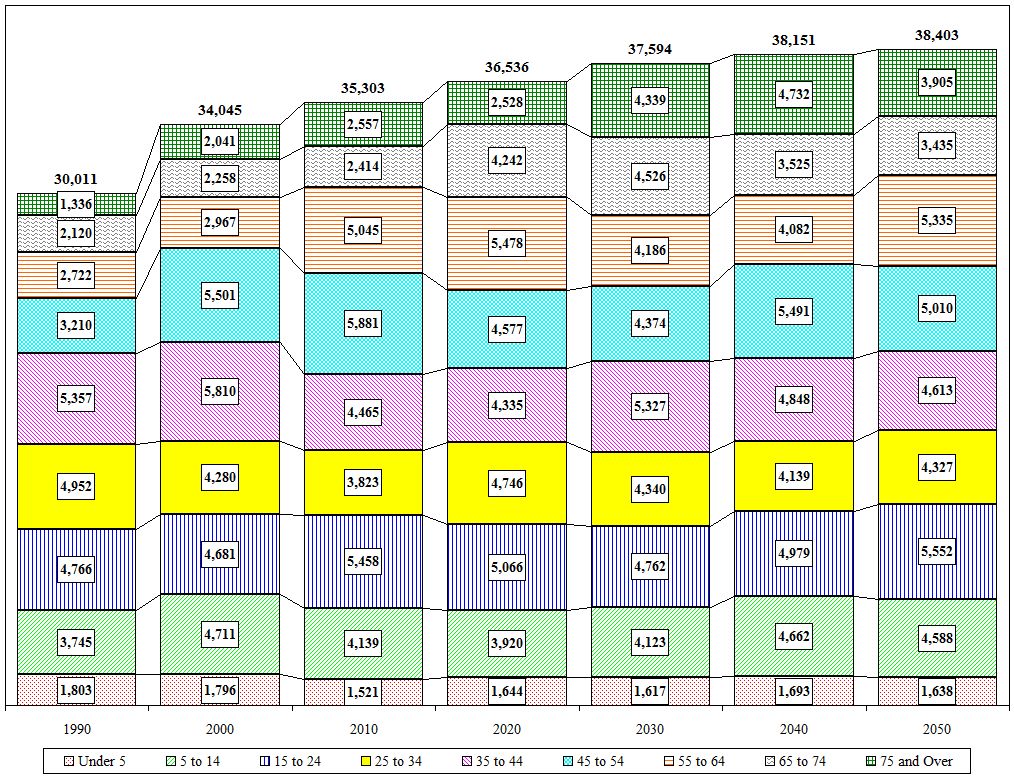
Town of Guilderland Age Cohort Projections
| Value |
Historic |
Projected |
| Village Values Included |
1990 |
2000 |
2010 |
2020 |
2030 |
2040 |
2050 |
| Total |
30,011 |
34,045 |
35,303 |
36,536 |
37,594 |
38,151 |
38,403 |
| Under 5 |
1,803 |
1,796 |
1,521 |
1,644 |
1,617 |
1,693 |
1,638 |
| 5 to 14 |
3,745 |
4,711 |
4,139 |
3,920 |
4,123 |
4,662 |
4,588 |
| 15 to 24 |
4,766 |
4,681 |
5,458 |
5,066 |
4,762 |
4,979 |
5,552 |
| 25 to 34 |
4,952 |
4,280 |
3,823 |
4,746 |
4,340 |
4,139 |
4,327 |
| 35 to 44 |
5,357 |
5,810 |
4,465 |
4,335 |
5,327 |
4,848 |
4,613 |
| 45 to 54 |
3,210 |
5,501 |
5,881 |
4,577 |
4,374 |
5,491 |
5,010 |
| 55 to 64 |
2,722 |
2,967 |
5,045 |
5,478 |
4,186 |
4,082 |
5,335 |
| 65 to 74 |
2,120 |
2,258 |
2,414 |
4,242 |
4,526 |
3,525 |
3,435 |
| 75 and Over |
1,336 |
2,041 |
2,557 |
2,528 |
4,339 |
4,732 |
3,905 |
| Distribution |
1990 |
2000 |
2010 |
2020 |
2030 |
2040 |
2050 |
| Under 5 |
6.0% |
5.3% |
4.3% |
4.5% |
4.3% |
4.4% |
4.3% |
| 5 to 14 |
12.5% |
13.8% |
11.7% |
10.7% |
11.0% |
12.2% |
11.9% |
| 15 to 24 |
15.9% |
13.7% |
15.5% |
13.9% |
12.7% |
13.1% |
14.5% |
| 25 to 34 |
16.5% |
12.6% |
10.8% |
13.0% |
11.5% |
10.8% |
11.3% |
| 35 to 44 |
17.9% |
17.1% |
12.6% |
11.9% |
14.2% |
12.7% |
12.0% |
| 45 to 54 |
10.7% |
16.2% |
16.7% |
12.5% |
11.6% |
14.4% |
13.0% |
| 55 to 64 |
9.1% |
8.7% |
14.3% |
15.0% |
11.1% |
10.7% |
13.9% |
| 65 to 74 |
7.1% |
6.6% |
6.8% |
11.6% |
12.0% |
9.2% |
8.9% |
| 75 and Over |
4.5% |
6.0% |
7.2% |
6.9% |
11.5% |
12.4% |
10.2% |

Close

