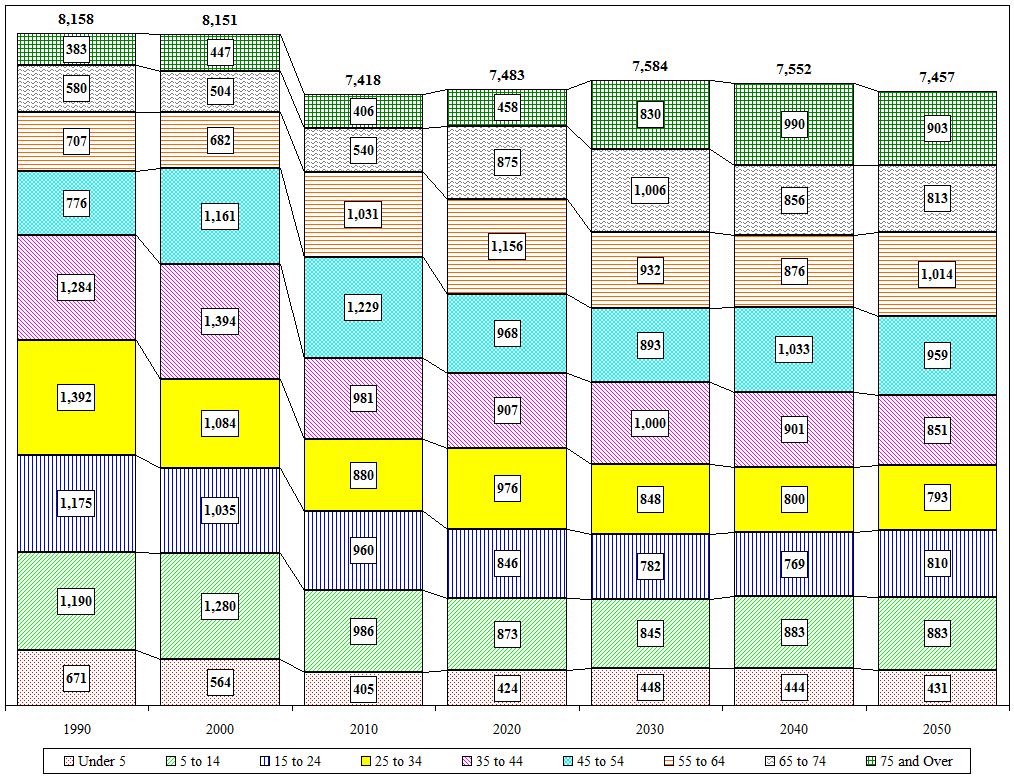
Town of Coeymans Age Cohort Projections
| Value |
Historic |
Projected |
| Village Values Included |
1990 |
2000 |
2010 |
2020 |
2030 |
2040 |
2050 |
| Total |
8,158 |
8,151 |
7,418 |
7,483 |
7,584 |
7,552 |
7,457 |
| Under 5 |
671 |
564 |
405 |
424 |
448 |
444 |
431 |
| 5 to 14 |
1,190 |
1,280 |
986 |
873 |
845 |
883 |
883 |
| 15 to 24 |
1,175 |
1,035 |
960 |
846 |
782 |
769 |
810 |
| 25 to 34 |
1,392 |
1,084 |
880 |
976 |
848 |
800 |
793 |
| 35 to 44 |
1,284 |
1,394 |
981 |
907 |
1,000 |
901 |
851 |
| 45 to 54 |
776 |
1,161 |
1,229 |
968 |
893 |
1,033 |
959 |
| 55 to 64 |
707 |
682 |
1,031 |
1,156 |
932 |
876 |
1,014 |
| 65 to 74 |
580 |
504 |
540 |
875 |
1,006 |
856 |
813 |
| 75 and Over |
383 |
447 |
406 |
458 |
830 |
990 |
903 |
| Distribution |
1990 |
2000 |
2010 |
2020 |
2030 |
2040 |
2050 |
| Under 5 |
8.2% |
6.9% |
5.5% |
5.7% |
5.9% |
5.9% |
5.8% |
| 5 to 14 |
14.6% |
15.7% |
13.3% |
11.7% |
11.1% |
11.7% |
11.8% |
| 15 to 24 |
14.4% |
12.7% |
12.9% |
11.3% |
10.3% |
10.2% |
10.9% |
| 25 to 34 |
17.1% |
13.3% |
11.9% |
13.0% |
11.2% |
10.6% |
10.6% |
| 35 to 44 |
15.7% |
17.1% |
13.2% |
12.1% |
13.2% |
11.9% |
11.4% |
| 45 to 54 |
9.5% |
14.2% |
16.6% |
12.9% |
11.8% |
13.7% |
12.9% |
| 55 to 64 |
8.7% |
8.4% |
13.9% |
15.4% |
12.3% |
11.6% |
13.6% |
| 65 to 74 |
7.1% |
6.2% |
7.3% |
11.7% |
13.3% |
11.3% |
10.9% |
| 75 and Over |
4.7% |
5.5% |
5.5% |
6.1% |
10.9% |
13.1% |
12.1% |

Close

