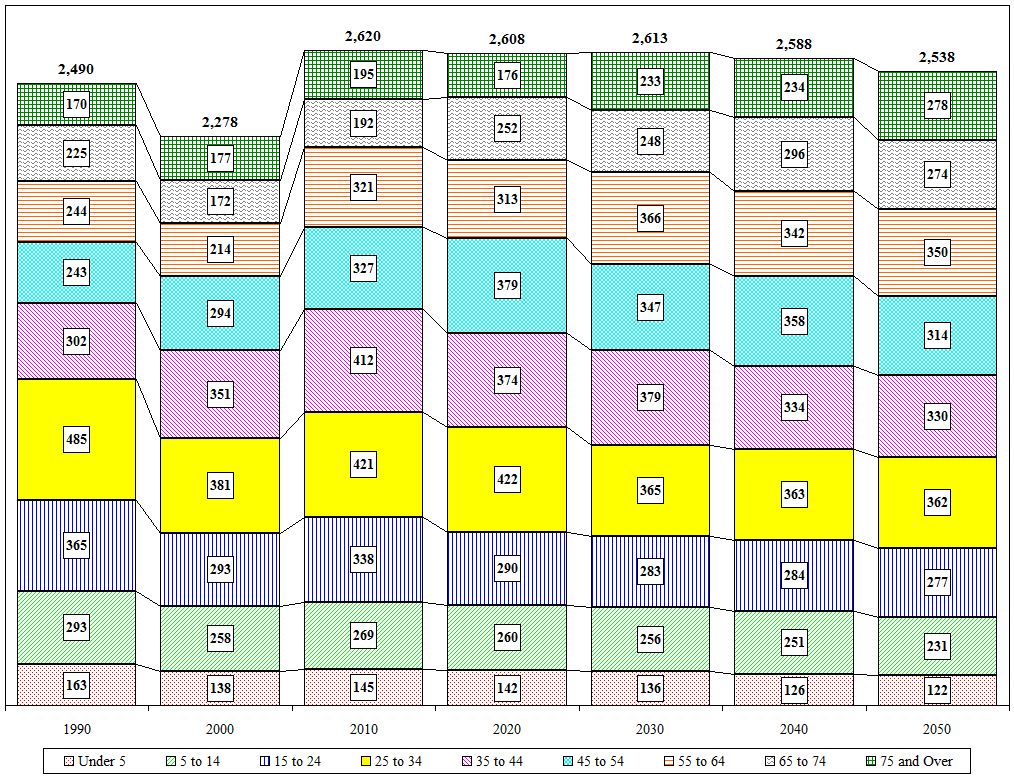
Town/Village of Green Island Age Cohort Projections
| Value |
Historic |
Projected |
| 1990 |
2000 |
2010 |
2020 |
2030 |
2040 |
2050 |
| Total |
2,490 |
2,278 |
2,620 |
2,608 |
2,613 |
2,588 |
2,538 |
| Under 5 |
163 |
138 |
145 |
142 |
136 |
126 |
122 |
| 5 to 14 |
293 |
258 |
269 |
260 |
256 |
251 |
231 |
| 15 to 24 |
365 |
293 |
338 |
290 |
283 |
284 |
277 |
| 25 to 34 |
485 |
381 |
421 |
422 |
365 |
363 |
362 |
| 35 to 44 |
302 |
351 |
412 |
374 |
379 |
334 |
330 |
| 45 to 54 |
243 |
294 |
327 |
379 |
347 |
358 |
314 |
| 55 to 64 |
244 |
214 |
321 |
313 |
366 |
342 |
350 |
| 65 to 74 |
225 |
172 |
192 |
252 |
248 |
296 |
274 |
| 75 and Over |
170 |
177 |
195 |
176 |
233 |
234 |
278 |
| Distribution |
1990 |
2000 |
2010 |
2020 |
2030 |
2040 |
2050 |
| Under 5 |
6.5% |
6.1% |
5.5% |
5.4% |
5.2% |
4.9% |
4.8% |
| 5 to 14 |
11.8% |
11.3% |
10.3% |
10.0% |
9.8% |
9.7% |
9.1% |
| 15 to 24 |
14.7% |
12.9% |
12.9% |
11.1% |
10.8% |
11.0% |
10.9% |
| 25 to 34 |
19.5% |
16.7% |
16.1% |
16.2% |
14.0% |
14.0% |
14.3% |
| 35 to 44 |
12.1% |
15.4% |
15.7% |
14.3% |
14.5% |
12.9% |
13.0% |
| 45 to 54 |
9.8% |
12.9% |
12.5% |
14.5% |
13.3% |
13.8% |
12.4% |
| 55 to 64 |
9.8% |
9.4% |
12.3% |
12.0% |
14.0% |
13.2% |
13.8% |
| 65 to 74 |
9.0% |
7.6% |
7.3% |
9.7% |
9.5% |
11.4% |
10.8% |
| 75 and Over |
6.8% |
7.8% |
7.4% |
6.7% |
8.9% |
9.0% |
11.0% |

Close

